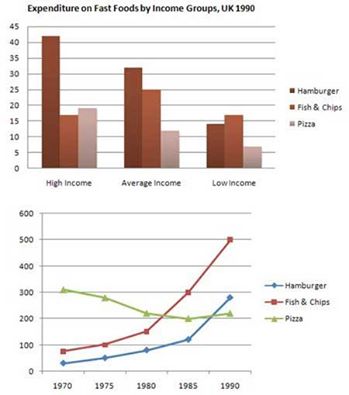
The bar and line chart illustrates about money spending on fast foods by people in britain in 1990. Overall, hamburger was by far the favorite one for british people to spend their money for, except in low income level. In this case, while pizza experienced a decreasing trend, an opposite was seen in the remaining figures.
Hamburger consumption far dominated the proportion of people spend in high and average income level at 42% and 32% respectively, but it was lower than fish and chips in low income. At the same time, with 17%, fish and chips consumption predominated in low income, while it was the lowest percentage in high income. Meanwhile, pizza consumption was higher than fish and chips in the high income at 18%, but it was the lowest level in average and low incomes level.
Turning to the line chart showing that between 1970 to 1980, the trend in consumption of hamburger and fish also chips rose slightly to around 150 and 90 whereas in the next 10 years, the figure increased dramatically, making their figures more popular than pizza. This was in marked contrast to the trend of pizza decreasing slightly to 200 over the 20 years.

mix_chart.jpg
