I am planning to take the IELTS test. Here is one of my essay. I really need to improve my writing skills in order to get the best preparation for the IELTS test.
Topic: The chart below shows the changes in car ownership in Great Britain between 1961 and 2001.
Summarise the information by selecting and reporting the main features, and make comparisons where relevant.
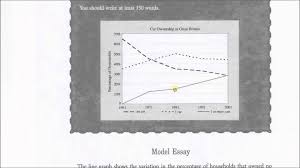
The line graph illustrates the different number of people who have cars in Great Britain during the period of 40 years from 1961 to 2001.
It can be seen from the line graph that the number of houses in Great Britain who had 2 cars experienced a remarkable growth from 1961 to 2001. There were no British houses had 2 or more cars in 1961 but nearly one-third of the population of Britain afforded to buy at least 2 cars in 2001. In contrast, there was a sharp decrease in the household in Britain who had no car from 1961 to 2001, fell approximately 40% from 65% to 29%. The percentage of families with no car reached a bottom at roughly 30% in 2001.
From 1961 to 2001, the percentage of one-car owners fluctuated from 35% to 50% reached a peak of 50%. In 1981, half of the population of Britain had one car in their house though from 1991 to 2001, the number of one-car owners remained stable at 45%. In 2001, the different walks of life were clear that nearly one- third of British residents had 2 or more car in their house and people who had no car constituted the same proportion.
Overall, the percentage of families with 2 or more cars rise sharply due to the considerable fall of no-car owners and the fluctuation of one-car owners from 1961 to 2001.
Car ownership in Great Britain
Topic: The chart below shows the changes in car ownership in Great Britain between 1961 and 2001.
Summarise the information by selecting and reporting the main features, and make comparisons where relevant.
The line graph illustrates the different number of people who have cars in Great Britain during the period of 40 years from 1961 to 2001.
It can be seen from the line graph that the number of houses in Great Britain who had 2 cars experienced a remarkable growth from 1961 to 2001. There were no British houses had 2 or more cars in 1961 but nearly one-third of the population of Britain afforded to buy at least 2 cars in 2001. In contrast, there was a sharp decrease in the household in Britain who had no car from 1961 to 2001, fell approximately 40% from 65% to 29%. The percentage of families with no car reached a bottom at roughly 30% in 2001.
From 1961 to 2001, the percentage of one-car owners fluctuated from 35% to 50% reached a peak of 50%. In 1981, half of the population of Britain had one car in their house though from 1991 to 2001, the number of one-car owners remained stable at 45%. In 2001, the different walks of life were clear that nearly one- third of British residents had 2 or more car in their house and people who had no car constituted the same proportion.
Overall, the percentage of families with 2 or more cars rise sharply due to the considerable fall of no-car owners and the fluctuation of one-car owners from 1961 to 2001.

If this image is blurred, please give comment on vocab and grammar. Thank you.
