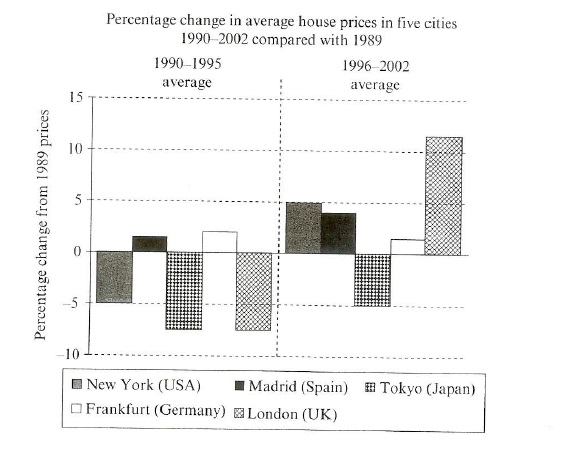
[/b]Topic: The chart below shows information about change in average house prices in five different cities between 1990 and 2002 compared with the average house prices 1989.[b]
The bar graph illustrates the changes in price of houses in five different cities from 1990 to 2000.
The average change in house prices between twelve years compared with the records of 1989. In first five years, Tokyo and London had least and equal average house prices, that was -7.5%. The average house prices of New York city was at -5% in same period. On the other side, Madrid and Frankfurt was two cities, that recorded maximum prices 2% and 2.5% respectively.
From 1996 to 2002, only Tokyo was below the records of 1989 with -5%, which was nearby to previously registered. Whereas, New York totally altered with the same percentage. Afterwards, Madrid boomed up by 2% than the last value, while Frankfurt revealed a slight drop between next seven years. Last but not least, London showed the rise in house prices like a sky rocket and noted at maximum among all cities with 12%.

Bar_graph.jpg
