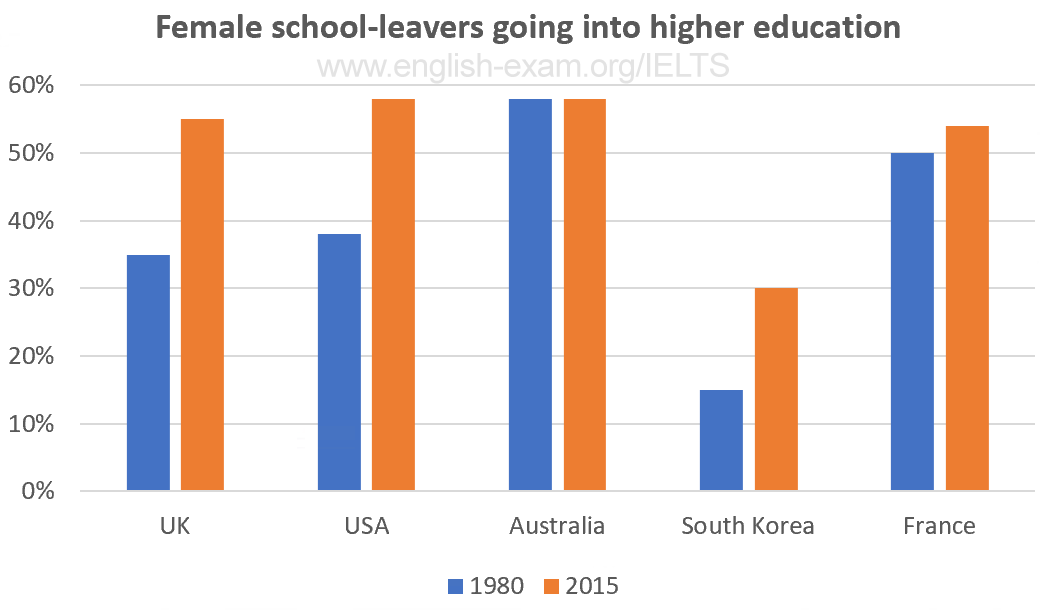
The chart gives information on the percentage of women going into higher education in five countries for the years 1980 and 2015.
The bar chart compares five countries in terms of the percentage for the female pursuing tertiary education in 1980 and 2015
Overall, apart from Australia, upturns from 1980 to 2015 were recorded in other countries. Although that of South Korea was the most marked compared to the rest, there are the fewest women attending college in this country
Specifically, taking the highest place with nearly 60% of the total women in 1980, no differences was recorded in the data for Australia after 35 years. At the bottom was the proportion for female higher students in South Korea, which stood at about 15% but witnessed the most evident growth of a factor of two in 2015.
Turning to the three other countries, there was a correlation in trends between UK and USA but the bars for USA was a bit higher. Of the three countries mentioned, the rise in the number of the French women pursuing higher education was the least noticeable.
Summarise the information by selecting and reporting the main features, and make comparisons where relevant.
The bar chart compares five countries in terms of the percentage for the female pursuing tertiary education in 1980 and 2015
Overall, apart from Australia, upturns from 1980 to 2015 were recorded in other countries. Although that of South Korea was the most marked compared to the rest, there are the fewest women attending college in this country
Specifically, taking the highest place with nearly 60% of the total women in 1980, no differences was recorded in the data for Australia after 35 years. At the bottom was the proportion for female higher students in South Korea, which stood at about 15% but witnessed the most evident growth of a factor of two in 2015.
Turning to the three other countries, there was a correlation in trends between UK and USA but the bars for USA was a bit higher. Of the three countries mentioned, the rise in the number of the French women pursuing higher education was the least noticeable.

1.png
