the revenue of a&v tech company
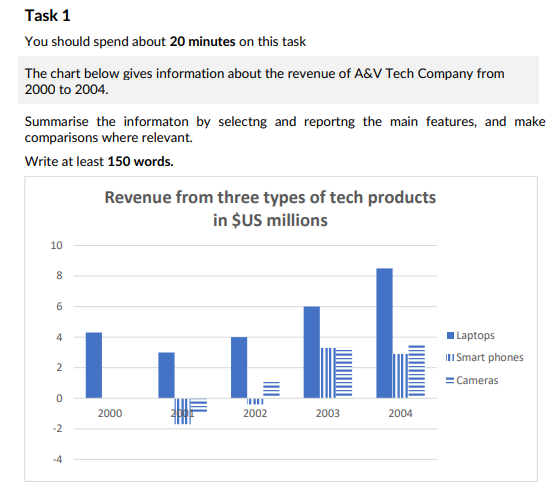
The line graph illustrates how much money was made by A&V Tech Company from three categories of electric devices between 2000 and 2004.
Overall, although the three trends were similar in terms of general decrease, it is evident that the income of laptops was much higher than that of smartphones and cameras over the course of time. The absence of figures for smartphones and cameras was also noticeable in 2000.
The sale of laptops was the only one to be shown in 2000, making over $4 million. This figure witnessed a decrease in the subsequent year but was able to recover to precisely $4 million by 2002. By contrast, smartphones and cameras reported losses in revenue of around $2 million and $1 million, respectively, in 2001. The figures for both experienced an increase in 2002, but only cameras made profits of $1 million, while smartphones' sales still showed losses of a little less than $1 million.
In the following year, the turnover of all products plummeted, especially smartphones, soaring by more than $3 million, compared with exactly and roughly $2 million for laptops and cameras, respectively. The cameras underwent marginal growth, finishing at nearly $4 million at the end of the period, whereas the smartphones gradually decreased to less than $3 million. The laptops later plunged and earned over $8 million, which was the highest point of the graph over the 5-year period.

task1.png
