Unanswered [1] | Urgent [0]
  

Home / Writing Feedback   % width   Posts: 4


TASK 1-CHART- household expenditure in New Zealand and UK


fatika3007 4 / 8  
Jun 29, 2020   #1

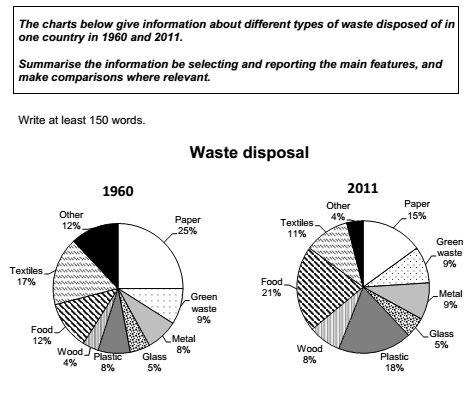
WASTE disposal


A comparison of household expenditure in New Zealand and UK between 1980 and 2008 is presented in the chart.
Overall, food and drink expenditure percentage showed a decline over 28 years period, while utility expenditure was the reverse. Also, UK residents tend to spend their budgets more on leisure than New Zealander.

Initially, larger proportion for households spending in New Zealand was on food and drink with 29%, and the parallel figure for UK was 23%. By 2008, a slightly decreased in food and drink budget in New Zealand and UK, with 4 % respectively. By contrast, both countries utility budget showed an increased from 27% to 31% in New Zealand and from 26% to 28% in the UK.

Money spent for picnic was the highest demand in UK, both 1980 and 2008. In contrast, it became third in New Zealand. In fact, there was a half in proportion differences between those who like to spend their money on vacation in both countries. Eventually, transport cost and other cost had roughly 10% and 15% bills respectively.

(176 words)

  • photo_20200629_23.jpg


vuthuylinh2611 19 / 61  
Jun 30, 2020   #2
I have some recommendations about your essay as follow:

- I think that you posted the wrong diagram.

- Your sentence has some errors:

'Initially, larger the larger/a large proportion for ... By 2008,there wasa slightly slight decreased in ... with 4 % and... respectively.

'Money spent for picnic was the highest demand accounted for the largest proportion of budget/expenditure in UK, both in 1980 and 2008

'there was a half in proportion differences ' I think you should revise this phase as I can't understand your ideas here.
Holt  Educational Consultant - / 15369  
Jun 30, 2020   #3
Since you did not upload the correct image, I will not be able to review and advise you regarding content and presentation improvements in your report. I'll be limited to general review.

You should be presenting a trending statement based only on 1 upward or downward trend in the chart. You should not be presenting a trend for every group presented. That is already a paragraph, not a trending statement.

You have to make sure to refer to the information within the right time frame. Practice past tense sentence structures when you do your general writing exercises. Always look at the dates. When you are dealing with previous years, those are always done in past tense. Your essay suffers in clarity and grammar range problems because of this problem that you have. You are reporting past data in present tense. That is incorrect.
OP fatika3007 4 / 8  
Jun 30, 2020   #4
thank you for your advice @Holt


Home / Writing Feedback / TASK 1-CHART- household expenditure in New Zealand and UK
Do You Need
Academic Writing
or Editing Help?
Fill out one of these forms:

Graduate Writing / Editing:
GraduateWriter form ◳

Best Essay Service:
CustomPapers form ◳

Excellence in Editing:
Rose Editing ◳

AI-Paper Rewriting:
Robot Rewrite ◳

Academic AI Writer:
Custom AI Writer ◳