Unanswered [1]
  

Home / Writing Feedback   % width   Posts: 2


The chart illustrates distances traveled per person per week (in kilometers) in terms of 5 types of


hichahee 1 / -  
Jun 1, 2023   #1

travel habits by mode of transport in the UK


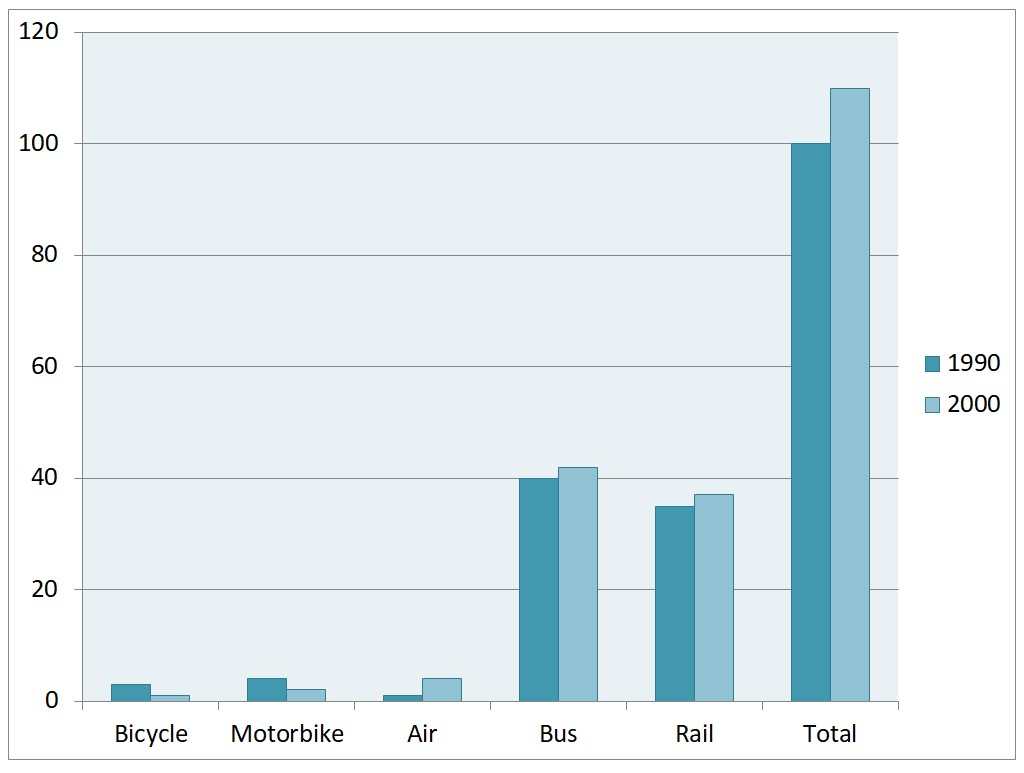
The graph below gives information about the changes in travel habits by mode of transport in the UK from 1990 to 2000.
Overall, there was a decrease in the use of bicycle and motorbike, while the figure for air, bus and railway saw opposite changes, resulting in the rise of the total numbers. In addition, the most common forms of travel were by bus and air.

Looking at the details, the number of bicycles used started at around 5km, before ending the period at just over 1km. Similar changes can be seen in the figure for motorbikes, which fell slightly to about 1km at the end of the period.

Conversely, the usage of air increased marginally from just 1km in 1990 to downward of 6km in 2000. Similar changes, but to a greater extent, can be seen in the figure for bus and air, which grew from precise 40km to slightly upward of 40km and 35km to just over 38km respectively.

  • Screenshot2021051.jpg


Holt  Educational Consultant - / 15460  
Jun 2, 2023   #2
As there are several types of bar graphs in use during this test, you need to be highly specific about the image identifier if you want to gain a higher score. This is not just a graph, it is one of 3 types of graphs in use in a task 1 essay. You should indicate that the image is a columnar bar graph. What does that do? It shows a coherent explanation of the image and also, increases your LR score since you are using a very specific identifier for the reference.

The analysis paragraphs need more work to show a better coherence or understanding of the images on your part. You limited yourself to 2 reporting sentences in this presentation. There should be at least 4, no more than 5 sentences here since the first half of the paragraph should report the information, while the last part should analyze the information. You did not do a very good job of representing the latter.


Home / Writing Feedback / The chart illustrates distances traveled per person per week (in kilometers) in terms of 5 types of
ⓘ Need Writing or Editing Help?
Fill out one of these forms for professional help:

Best Writing Service:
CustomPapers form ◳

Graduate Writing / Editing:
GraduateWriter form ◳

Excellence in Editing:
Rose Editing ◳

AI-Paper Rewriting:
Robot Rewrite ◳