Unanswered [1] | Urgent [0]
  

Home / Writing Feedback   % width   Posts: 2


The chart provides information about UK immigration, emigration and net migration; IELTS TASK 1


Sakuradesu 3 / 4  
Oct 29, 2023   #1

International migration in UK


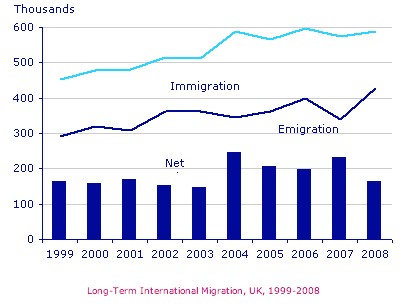
The chart provides information about UK immigration, emigration and net migration between the years of 1990 and 2008.

It can be explicitly observed that while there was an increase in the number of both immigrants and emigrants, the figure for immigration was much more significant over the given period. Net immigration reached its peak in the year 2004.

In 1999, the number of people moving to the UK for inhabitancy was roughly 400,000 compared to nearly 300,000 recorded emigrants. There was a stable rise in immigration, which achieved approximately 600,000 people by 2004. In contrast, immigration initially showed a steady trend before rising to around 380,000 people in 2003.

Net immigration had 200,000 people by 1999 and experienced an inconsiderable change from 1999 to 2003. This figure later peaked with about 250,000 people, which was followed by fluctuations and dropped to around 180,000 people at the end of the period.

  • hinh52.jpg


Holt  Educational Consultant - / 15385  
Oct 30, 2023   #2
You must always identify the type of image being presented for clarity purposes. Simply saying a chart was presented does not help the reader understand or imagine how the chart is supposed to function in terms of information dissemination. That is actually one of the weak points of your presentation. Remember that image identification helps with the C+C and GRA scoring considerations. Do not overlook its importance.

Additionally, the overall review and analysis presentation is too short. You wrote only 150 words. The exact minimum number. That does not leave you with any extra scoring considerations should you gain deductions in any scoring section. One low score in a section and you will automatically receive a failing score. Write at least 175 words next time to make allowances for deductions in your score.


Home / Writing Feedback / The chart provides information about UK immigration, emigration and net migration; IELTS TASK 1
Need Writing
or Editing Help?
Fill out one of these forms:

Graduate Writing / Editing:
GraduateWriter form ◳

Best Essay Service:
CustomPapers form ◳

Excellence in Editing:
Rose Editing ◳

AI-Paper Rewriting:
Robot Rewrite ◳

Academic AI Writer:
Custom AI Writer ◳