Unanswered [2]
  

Home / Writing Feedback   % width   Posts: 2


The chart below show reasons why Americans travelled and the pie chart what problems concerned them


ntoaht17 1 / -  
Aug 16, 2023   #1

reasons for travel and the main issues for the travelling public in the US 2009


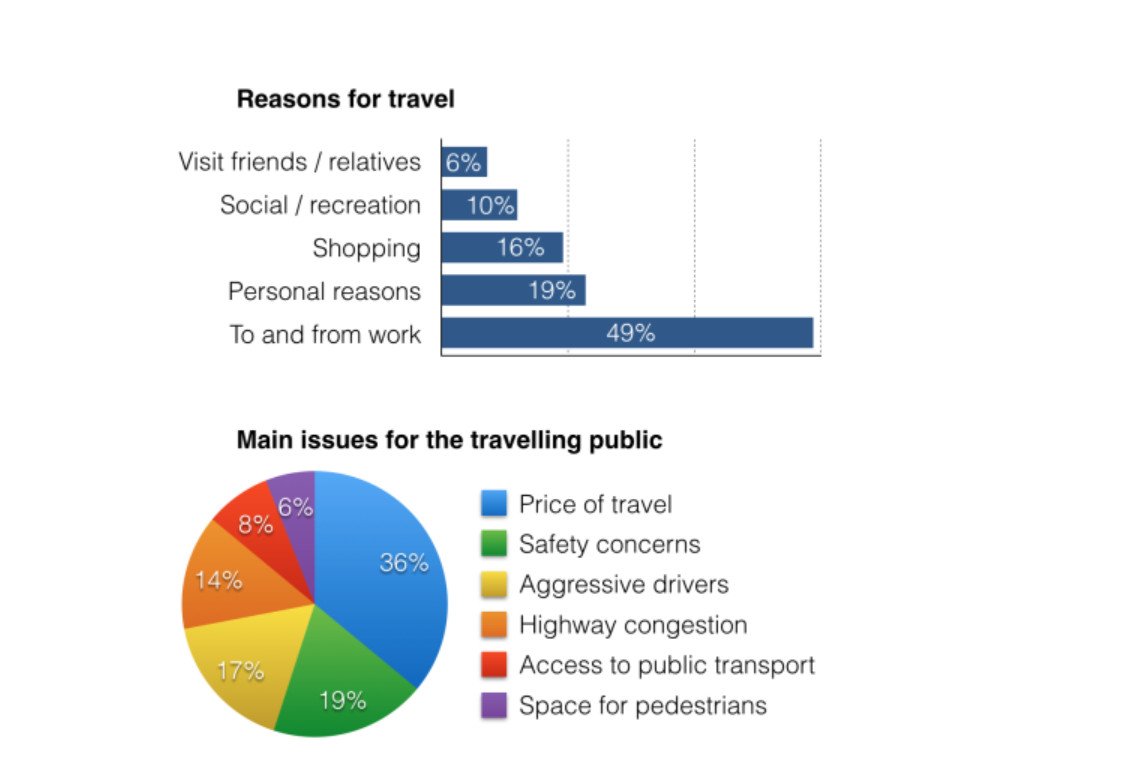
The provided bar chart illustrates reasons why Americans travelled and pie chart shows what problems concerned them when travelling in 2009

Overall, it can be seen that the main reason for travel of people in the US was to and from work in the year 2009. At the same time, the major travel issue of Americans was the costs.

Looking at the statistic in bar chart, it is clear that people with the purpose of commuting accounted for 49%, while the proportion of Americans going out for personal reasons stood at 19%. Additionally, the rate of people in the US taking a trip for shopping and recreation made up 16% and 10% Meanwhile, only 6% were visiting to friends or relatives.

Turning to pie chart, 36% of people in the survey said that price was the most concerning problem when going out. The fraction of safety concerns stood at 19%, meanwhile aggressive driving made 17% of them worried when leaving home, followed by highway jam, at 14%. In addition, access to public transportation and place for people to walk occupied the lowest points, only 8% and 6%.

  • z4609096368964_9fef5.jpg


Holt  Educational Consultant - / 15487  
Aug 21, 2023   #2
There is an immediate problem to be found in the summary overview presentation. The first, is that you wrote the explanation using a run-on sentence when you should have used 2 stand alone sentence to reference the separate images and content. The second, is the lack of punctuation usage at the end of the paragraph, leaving an open sentence in the presentation. Both errors will result in GRA deductions in the preliminary scoring section.

statistic

Wrong word usage. Use the plural form, statistics. You are dealing with more than one information reference point here.

When writing the trending statement for 2 different images, provide clarity to the reader. You need to separate the information presentation by identifying which type of image is associated with the given information. Otherwise, the presentation becomes confusing for the reader, resulting in further GRA deductions.


Home / Writing Feedback / The chart below show reasons why Americans travelled and the pie chart what problems concerned them
ⓘ Need Writing or Editing Help?
Fill out one of these forms for professional help:

Best Writing Service:
CustomPapers form ◳

Graduate Writing / Editing:
GraduateWriter form ◳

Excellence in Editing:
Rose Editing ◳

AI-Paper Rewriting:
Robot Rewrite ◳