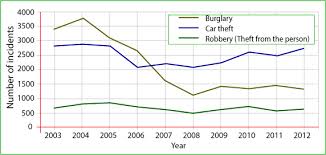
The chart shows the changes that took place in three different areas of crime in Newport city center from 2003-2012The shade of crime rates in three areas in Newport city center between the year 2003 and 2012 is illustrated in the line graph. It is noticeable that the burglary and the car theft have predominated throughout the year, while the robbery is the least crime.
From the chart, it is shown clearly that the burglary peaked in 2004 at nearly four thousands crimes, hereafter the figure was upward and dipped at about 1,200 significantly in 2000 before it begun increase and stable until 2012. In compared to the robbery, the feature revealed always plateau over the year (2003-2012) in which was around 500 to nearly 1,000 crimes.
In addition, we can see in the chart vividly that the car theft initially was stable from the year 2003 to 2005, thereafter it plunged into two thousands in 2006. However, the figure depicted rise again up to the year 2012 at nearly 3,000 crimes respectively.

download.jpg
Hi ani, it's a pleasure to read your writing. I would like to suggest you to split up the sentence "From the chart, it is shown clearly that the burglary ..." into: From the chart, it is shown clearly that the burglary peaked in 2004 at nearly four thousands crimes, .Hereafter, the figure was upward and dipped at about 1,200 significantly in 2000 before it begun increase and stable until 2012. Regards..
Hi, Aini. I find your writing is simple, easy to read, and understandable. However, I want to give you some suggestions to help you enhance your writing.
- From the chart,Based on the chart , it is shown
- before it begun increasebegan to increase
- the feature revealed always plateaube stable
- we can see in the chart vividlyit can be seen that the car theft
There you have it Aini, I hope the corrections are useful and helpful to your revision. Keep writing and good luck :)
Hi @ainirere, here is my correction.
The shade of crime rates in three areaswith various different places in Newport city center; robbery, burglary and car theft, between the year 2003 and 2012 which is illustrated in the line graph. It is noticeable that the robberyburglary and the car theft have predominated throughout the yearremained stable during the period; despite a bit of fluctuation while the robbery is the least crimethere was a significant decrease in the burglary.
As observed from the chart, it is shown clearly that the incidents number of the burglary reached a peakpeaked in 2004, at nearly four thousands crimes by 2003 . Hereafter the figure was upward and dipped at about 1,200 significantlysubstantially fell and ended at approximately 1000 incidents in 2000 before it beguna slightly increase and steadiness until 2012. In compared toIn terms ofthe number of incidents in the robbery, the feature figure revealed always plateau over the yearmildly fluctuated (2003-2012) in which was , from around 500 to nearly 1,000 crimes.
hello Aini, it's a pleasure to read your understandable writing. let me give you some advice
The shade of crime rates in three areas in Newport city center between the year 2003 and 2012 is illustrated in the line graph.
it is better for you to make a grouping idea based on the year. The first body of essay discusses about the upward trend during 2000 to 2005, and afterwads the second body paragraph discusses the trend between 2005 and 2012. In this part, you should talk about fluctuated trend and mention the unique thing occured ( the greatest rate decreased dramatically and exchanged with the blue one. you should mention the highest and lowest one in this part.
warm regard
Hi Aini, it's pleasure to read your writing because it's simple. Let me give you some suggestions to improve your writing skill.
In the second paragraph you don't need try to mention all of the number, it's better to give more interesting data.
Then, it is better to mention:
'Car theft was the most highest crime in the beginning of the period but between 2006 and 2012 burglary was very high crime among others.'
Regards
Hi all thank you for your corrections and suggestions :)

