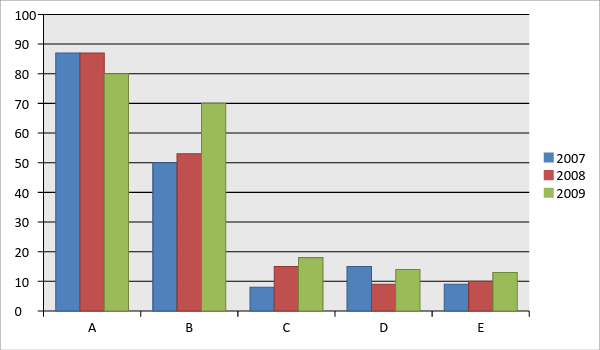
the percentage of films made in 5 countries
Hi everyone, I am in the process of preparing for the IELTS test and I need some advice for my writing task 1. Thank you very much!
The given bar chart illustrates the proportion of films made by 5 different countries, namely A, B, C, D and E for years since 2007. It is measured by percent.
Overall, in the entire surveyed period, the rates of B, D and E showed an upward trend. Meanwhile, a reverse pattern can be seen towards A and C.
In 2007, the rate of film production in A took a lead, at 80%, which was 4 times higher than that of its counterpart - C. In the next 2 years, A's film production lost momentum and plunged to roughly 76%. Although the percentage of film produced by C climbed to 23% in 2008, it fell to 19% at the end of the period. (It is noted that A invested the most in the film-making industry among all the factor surveyed).
In stark contrast, in 2007, the ratio of films made by E was 5%, which was the lowest point on the whole graph, compared to those of D (14%) and B (34%). 2 years later, the former and the latter increased gradually to about 8% and 16% respectively, while B gathered the pace and rebounded to 50% in 2008.

okkoko.png
