Unanswered [1]
  

Home / Writing Feedback   % width   Posts: 6


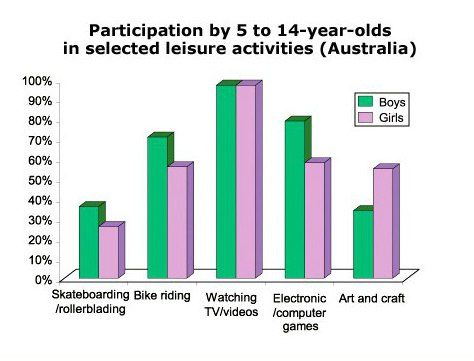
The chart below shows participation in certain leisure activities by children in Australia


ASooshd 1 / -  
Apr 16, 2017   #1

kids spending most of their leisure time staring at a screen


IELTS Writing task 1
The chart below shows participation in certain leisure activities by children in Australia
The given figure represents the information on Australian kids' engagement in particular pastime activities. Overall, it is clear that the most of free time Australian kids spent on watching TV and videos.

Taking a closer look into details, it can be seen that skateboarding and rollerblading is the least favourite occupation of 5 to 14-years-old Australians, as boys and girls spend only 40% per cent of their leisure time on this respectively. In contrast, both young males and females watch TV and videos almost all their pastime as it constitutes 100% per cent.

Taking bike riding and computer games playing, they have slightly similar pattern, because girls devote 60% of their free time on those activities, whilst boys are more interested in them. For instance, playing computer games is calculated at 80% per cent of their leisure time and 70% per cent of it is dedicated to bike riding. Furthermore, 5 to 14-years-olds in Australia are keen on doing art and craft, which is accumulated at 57% per cent for girls and 39% per cent for boys of their pastime use.

In conclusion, it is obvious that youngsters in Australia are more fascinated by spending their time on TV than on any other activity.

  • 0shBoTU2po.jpg


akbarmappiare 31 / 445  
Apr 17, 2017   #2
Hi Anasta, I have read your writing closely and found a few errors which you should fix them.
Firstly, I have to admit that you have endeavored to paraphrase the statement in the introductory paragraph. However, you did not deliver proper words to describe what you mind. That is different with its meaning. Make sure that you write is what you mind. For the writing task 1, you don't need a conclusion. It is sufficient if you only include the overview. The conclusion is identical with the writer's perception.

After that, you have lost a few of your score for coherence and cohesion because you have shown inappropriate data. You can check your information in the first sentence of the first body. You only wrote one percentage although you mentioned two figures. In addition, avoid the words representing your perception. You have used the word "for instance". That is generally harnessed in the writing task 2. Your huge problem is delivering the proper words. Contents of this writing have created a bad flow because you placed the word inappropriately. Pay attention to this matter on condition that you wanna reach the high score.

Hopefully, those can help you for finalizing this.
GOOD LUCK
Ahmadham 4 / 11  
Apr 22, 2017   #3
Hello let me give you some correction.

Overall, it is clear that the most of free time ...

One rule can be noticed when making an overview is that the the overview should represent the data generally. Only describing one particular figure does not cover the proper overview. Here in the following is additional component to make your overview powerful

"Australian kids are more interested in spending their leisure time on watching TV and videos. Also, the figure indicates that with the exception of Watching TV and Art& craft, boys dominate the all activities.

Taking a closer look into details, it can be seen ...

In this prompt, apart from comparing one particular activity to others, actually the writer is also asked to contrast the value gained by both genders. However, i did not notice any in your second body paragraph.

A good example to illustrate this seemingly is in the following

A closer look at the graph reveals that occupying the least interesting activities, skateboarding and rollerblading was dominated by boys at 40% while only 29% girls do this game. In Art and craft, by contrast, an opposing trend occurs when the number of female children taking a part was 20% higher than that males children do only accounting for 40%.
mandyduong 4 / 9  
Apr 23, 2017   #4
Hi, nice try on IELTS Writing Task 1.
1. I think you have used % and percent at the same time which is not necessary (and even wrong I think), so just choose 1.
2. Try to use more synonyms e.g. pastime = free time = availabilities ...
3. Use more influencers (markers) e.g Concerning, As regards, As for... to move/ connect to the new points
4. Try to make each paragraph with at least 3 sentences.
Work hard and good luck!
agus_mono 13 / 23  
Apr 25, 2017   #5
hay @ASooshd
i have several advice for this essay

firstly, on your overview, it is better if you use passive sentence, because you wrote it in active and it gives different meaning. you have to pay attention on it. turning to the second paragraph, you picked the highest and the least figure as interesting features. unfortunately, there were inappropriate data that you wrote. you said that the least favorite for both young males and females is watch TV and videos, but for boy there was a similar number with boys in art. so you have to focus on selectig interesting data.
Reza_Hidayat 13 / 18  
Apr 25, 2017   #6
@ASooshd
In my point of view, it is better to put the main idea in the first line in each paragraph. It could help you arrange to manage all aspects of cohesion well. Try to find key features in the chart since you are more likely to focus on details. I think that you have used a mix of simple and complex sentence and you have good control of punctuation. You are able to get a higher score in grammatical range and accuracy if you use a variety of complex structure or wide range of structure with full flexibility


Home / Writing Feedback / The chart below shows participation in certain leisure activities by children in Australia
ⓘ Need Writing or Editing Help?
Fill out one of these forms for professional help:

Best Writing Service:
CustomPapers form ◳

Graduate Writing / Editing:
GraduateWriter form ◳

Excellence in Editing:
Rose Editing ◳

AI-Paper Rewriting:
Robot Rewrite ◳