IELTS WRITING TASK 1 BAR CHART
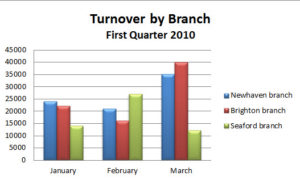
The chart below shows the sales revenue in dollars at three branches of a bank in the first quarter of 2010
The bar chart compares the number of turnovers in dollar of three different bank branches in the first three months of 2010
Overall, with the exception of Seaford bank, two other ones managed successfully to raise their sale revenues with the more pronounced increase being seen in the Brighton branch.
As can be seen from the chart, Brighton bank 's earnings stood at nearly 25,000 dollars in January prior to a sudden drop to around 15,000 dollars, which was lower than Newhaven branch with 20,000 dollars in February. However, Brighton bank made an unexpected recovery by skyrocketing its income to 40,000 dollars, which was the highest revenue among the three branches, a month later. Similarly, Newhaven bank's turnover went up to precisely 35,000 dollars in the same given month.
In contrast, a reverse trend was seen in the Seaford branch's revenue. This bank stood at nearly 15,000 dollars revenues before gaining 12,000 dollars, around 27,000 dollars, to become the most profited one in February. However, a remarkable fall to 11,000 dollars in its earning was recorded, resulting in its turnovers being the extremely lower compared to two other banks in the next month.
p/s: wish can get a lot of comments from all of you. I'm a newbie to ielts so please, don't judge me too hard.

image1.png
