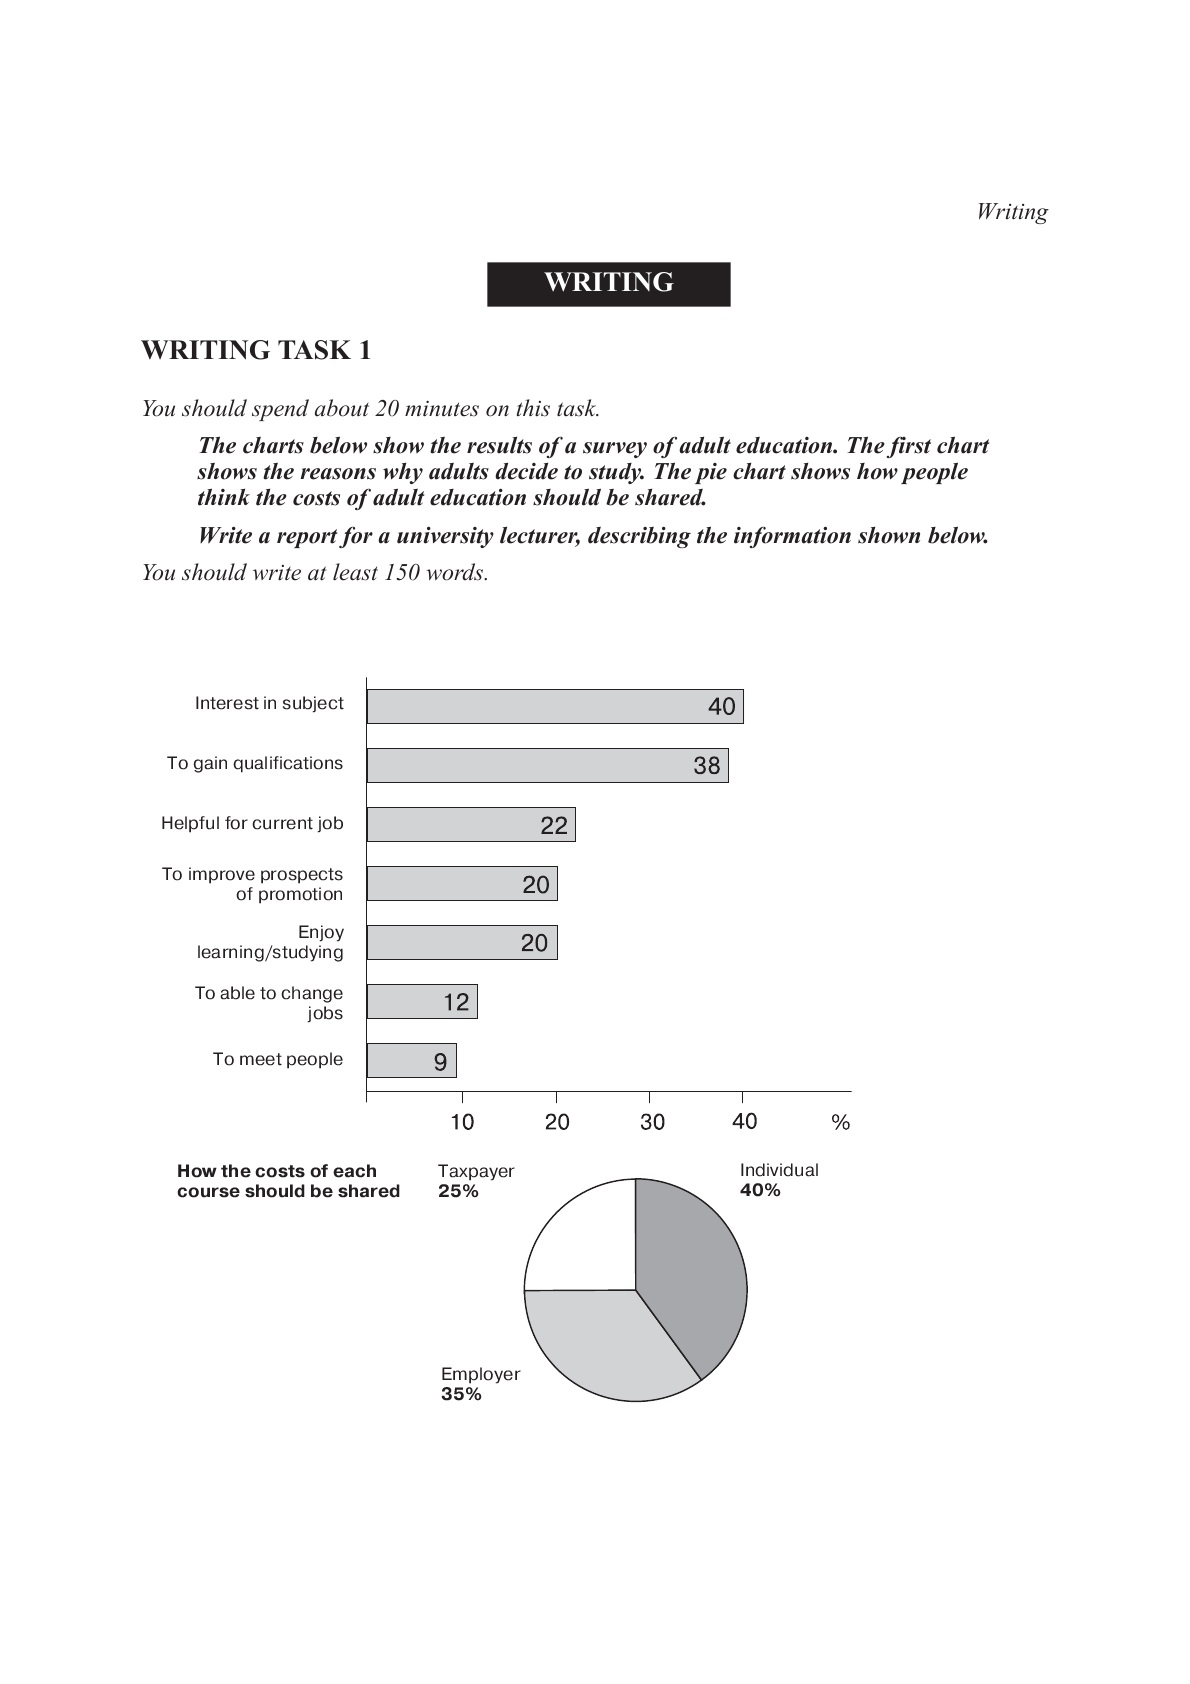
The charts below show the diversity and change . The first chart shows the reasons why adults decide to study. The pie chart shows how people think the costs of adult education should be shared.
Write a report for a university lecturer, describing the information shown below.
Adult Education is a growing field. For this reason, a survey was conducted to determine why adults decide to study. Interest in subject was the reason for 4 out of each 10 persons were asked. While 38 % think it is necessary to gain qualifications, only 22 % think it is helpful for current job and 20 % believe it is important to improve prospects of promotion. In addition 12 % of people think it is important to change jobs.
On other hand, 29 % do not share the same thinking but it is good as they enjoy studying and some said it is good to meet people.
Funding is the most important dimension in the process. People think that they should pay only 40 % of the cost while the balance should be paid by employers, 35 % and tax payers, 20 %.
**************The chart is attached, thanks in advance*********************

The chart
