Banana export and it's cost
Hello, it's my first using this amazing website.Can you please read my essay and comment? Thank you so much.
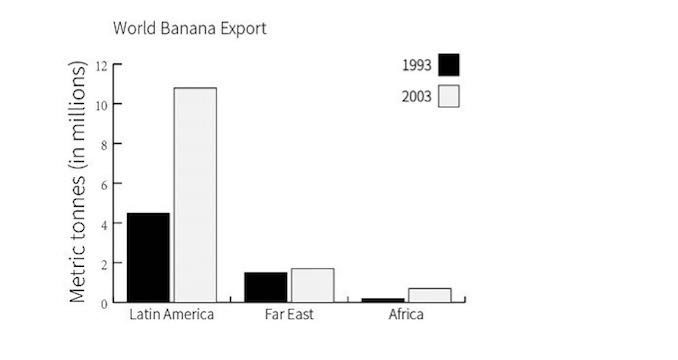
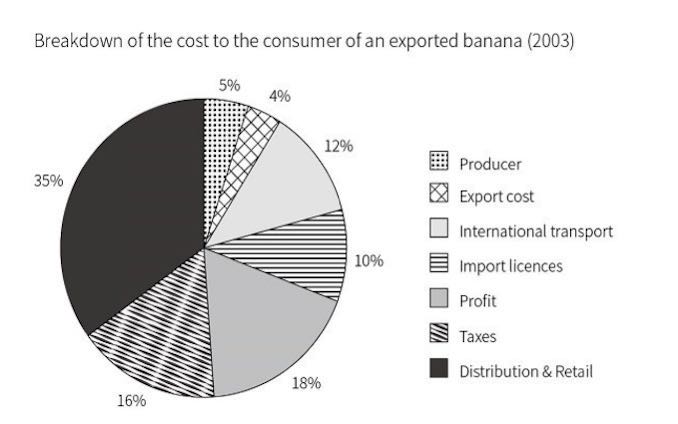
The charts below show the banana export in 1993 and 2003, and a breakdown of the cost to the consumer of each banana in 2003.
Summarise the information by selecting and reporting the main features, and make comparisons where relevant.
The given bar chart compares the changes of the amount of bananas were exported from three regions within a 10-year period, meanwhile the pie chart demonstrates the proportion of how much each procedures cost from the total price of one banana in 2003.
It is clear that Latin America made the most remarkable enhancement in banana export,in comparison the improvement of banana export made by Africa and Far East was less significant. Also the cost on distribution and retail was the highest among others.
In the bar chart, Latin America had the highest number of banana export in 1993,at around 4.5 million, followed by a sharp increase, as a result there were over 10 million metric tonnes of bananas exported. Africa was the region with least amount of banana exported in 1993,at approximately 0.5 million,its number jumped to 1 million in 10 years.There were little increase in Far East's banana export,the figures were under 2 million throughout the period.
In the pie chart,distribution and retail account for one thirds of overall cost, at 35%, while the export cost was the lowest,only 4%. In addition, the percentage of the source of the banana was surprisingly the second lowest,at merely 5%. International transport, import licenses and taxes summed up for almost two fifths of entire cost. Finally,18% of the money was left as profit.

_2020073.jpg
_2020073.jpg
