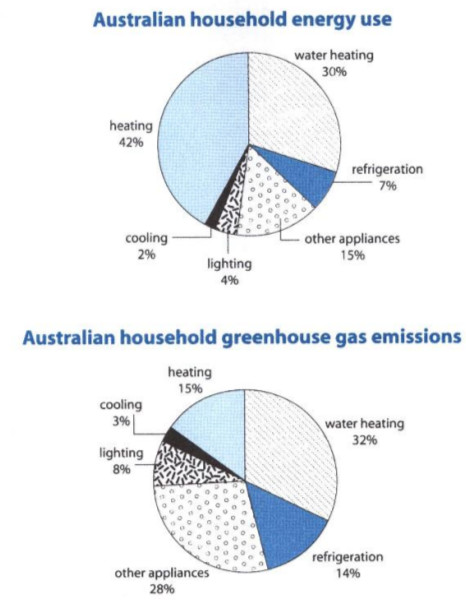
The first chart below shows how energy is used in an average Australian household. The second chart shows the greenhouse gas emissions which result from this energy use.
Summarise the information by selecting and reporting the main features, and make comparisons where relevant.
Two pie charts illustrate the mean use of different kinds of powers in homes for Australi's citizens and the amount of greenhouse gas production in contrast. It shows that the highest amount of the greenhouse gas is released by water heating, and the lowest amount goes to cooling.
The water heating process takes 30% of total energy used and produced 32% gas. After that there is refrigerating with 7% power consumption. However, the greenhouse gas production is double with 14%. Nevertheless, other appliances almost have the same characteristic, with 15% of energy consumption and 28% gas production.
The heating process which takes the highest amount of power usage by 42%, generates only 15% gas. And the cooling category has respectively 2% and 3% for power and gas generation. so as lighting with 4% and 8% in the same order.
It seems that the heating process with the most energy usage, surprisingly produces much less gas than other; in fact, it is third to last. And other appliances which use 15% power, generates also more gas; as a matter of fact, it is second to first in gas production.
(172 Words)
Summarise the information by selecting and reporting the main features, and make comparisons where relevant.
greenhouse gas as result of heating process
Two pie charts illustrate the mean use of different kinds of powers in homes for Australi's citizens and the amount of greenhouse gas production in contrast. It shows that the highest amount of the greenhouse gas is released by water heating, and the lowest amount goes to cooling.
The water heating process takes 30% of total energy used and produced 32% gas. After that there is refrigerating with 7% power consumption. However, the greenhouse gas production is double with 14%. Nevertheless, other appliances almost have the same characteristic, with 15% of energy consumption and 28% gas production.
The heating process which takes the highest amount of power usage by 42%, generates only 15% gas. And the cooling category has respectively 2% and 3% for power and gas generation. so as lighting with 4% and 8% in the same order.
It seems that the heating process with the most energy usage, surprisingly produces much less gas than other; in fact, it is third to last. And other appliances which use 15% power, generates also more gas; as a matter of fact, it is second to first in gas production.
(172 Words)

fig.jpg
