summarise the information - the pie and the bar chart
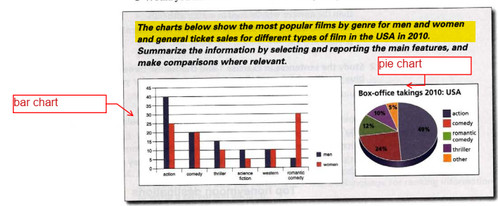
The given bar chart depicts the ratio of the most expected films based on types for men and women, and the pie chart indicates the number of ticket sales for each type in the USA, in 2010.
Overall, it can be seen that from the bar chart, for men, action films were the most popular while romantic comedies films were the best choice for women. From the pie chart, action films accounted for nearly 50 percent of ticket sales, only five percent being other types not listed in the chart.
In detail, as regards action films, 40 percent of men said they like this, while only 25 percent of women supposed that they enjoyed action types. By contrast, six times as many women liking romantic comedies as men, at 30 percent and five percent respectively. The number of men and women who liked comedies and western films was equal, at 20 percent and ten percent. Fifteen percent of men were interested in the thriller, whereas only ten percent of women liked this. In science fiction films, the number of men who liked this type was twice higher than the number of women, at ten and five percent in turn.
Looking at the pie chart, action films sold the most tickets, at 40 percent, making it significantly more common than comedies, at 24 percent. Romantic comedies came next, at 12 percent, while thriller was slightly less popular at ten percent. Bottom of the list was other types of films with only five percent of ticket sales.

z2896614593254_a7189.jpg
