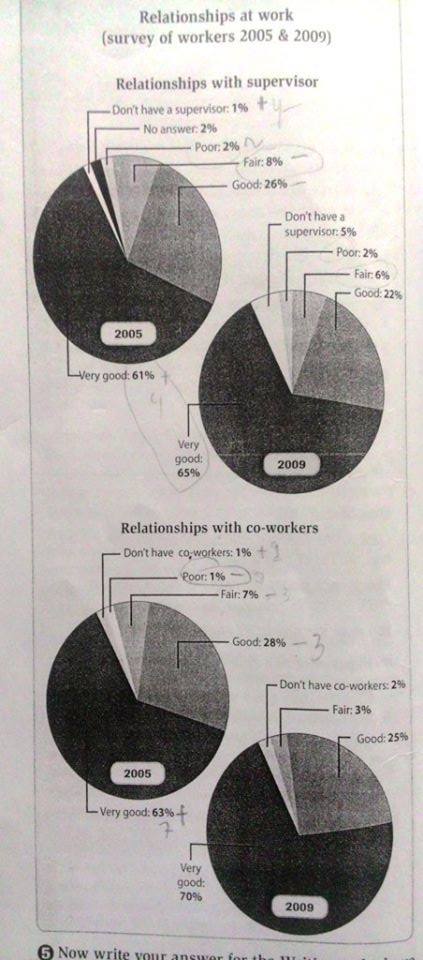
The charts below show the results of surveys in 2005 and 2009 asking workers about their relationship with their supervisors and their co-workers.
The charts give information about the percentage of relationship people who have a job in a company with their supervisors and co-workers in 2005 and 2009. Overall, it can be seen that employees have very good relationship with their supervisors and co-workers in 2003 and 2009.
Relationship workers with their supervisors in 2005 is very good with the percentage is 61. Then, it is followed by good category as much as 26 percent, fair relationship is 8%. While, in 2009 the percentage was increase 65. It can be say that, very good category relation, 22 percent employees have good relationship and 65 percent is fair.
On the other hand, the percentage of relationship workers with their co-workers in 2005 and 2009 is 63 and 70, both of them is very good relation. While, others are have good relation above 24 percent. In 2005 workers have fair relation is 7 percent and 2009 is 3 percent. Just at least 1-2 percent which argue they do not have poor relation or co-workers.

289091_1_o.jpg
