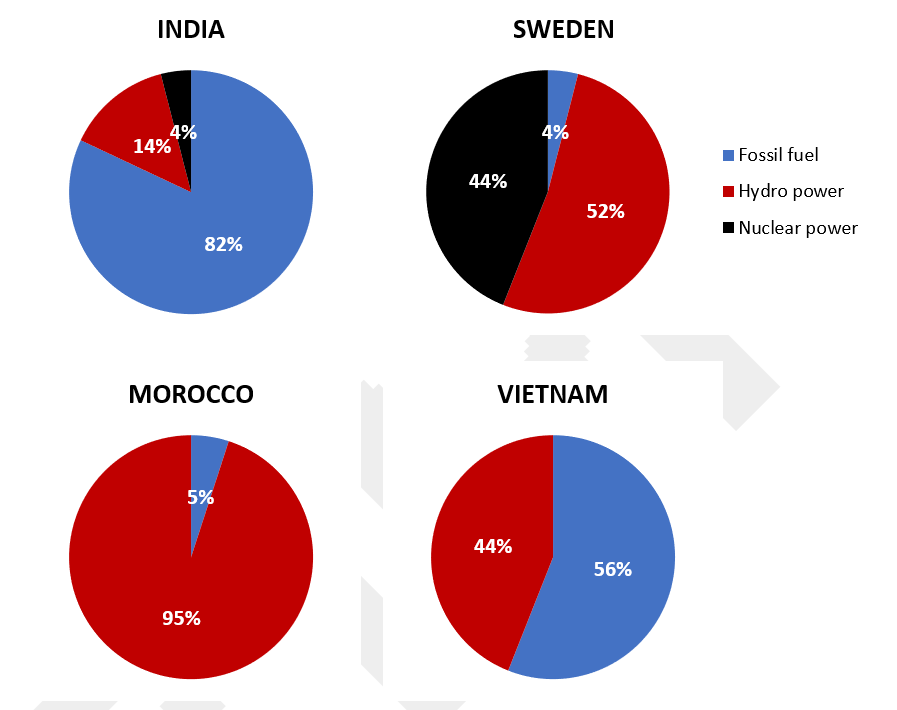
The pie charts compare the amount of electricity being produced among 3 energy sources in 4 countries between 2003 and 2008.
Overall, fossil fuel took the highest proportion in India and Vietnam while in other countries, hydro power stood out as the primary source.
India and Sweden are two countries that produced electricity by 3 sources of energy: fossil fuel, hydro power and nuclear power. 82% of electricity was made by fossil fuel in India while in Sweden, there was just small amount of it being used, accounting for 4%. In Sweden, hydro power and nuclear power took the lead, comprising 52% and 44% of the total amount in contrast to India where there was just 14% of hydro power and 4% of nuclear power.
Morocco and Vietnam just produced electricity by 2 ways: using fossil fuel and hydro power. Almost the amount of electricity in Morocco was generated by hydro power, just 5% of it was contributed from fossil fuel. However, in Vietnam, more than half of eletricity production was from fossil fuel, took up to 52%. Following closely, hydro power was responsible for 44% of electricity amount.

PieChart1.png
