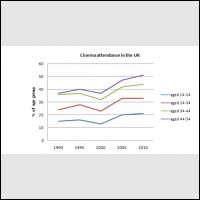
A breakdown of the figure for cinema attendance between 1990 and 2010 in the UK is showed in line chart. This is measured in percentage. As per chart, the data is divided into four age groups: 14-24 years, 24-34 years, 34-44 years, and 44-54 years. This is important to notice that Overall the level of age groups revealed a slight increase. While aged 44-54 was the highest percentage over the period, the less popular cinema was seen in percentage of aged 14-24.
In the beginning of the period, The percentage of aged 44-54 was the same as cohort of aged 33-44 had been at 38 % while age group of 24-34 years roughly had a half as much. The very small proportion was seen in level of aged 14-24.
A part from previous comparisons, overall changes were not always steady, in 2010, the most noticeable proportion was showed in bracket of 14-24 ages, when this increase from 48 % to approximately five out of ten. Then reach a peak in the same time. This significantly widened a gap to others ages. While the level of aged 33-44 and aged 14-24 saw a continuous and steady increase, by almost the same amount, another level is seen stagnancy in roughly 32 %. Between 2000-2005, overall, the four group of ages was showed a gradual increase after a downward in the previous year.

267312_1.jpg
