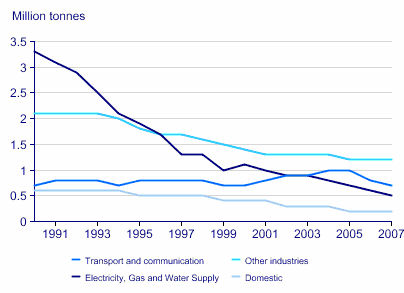
Q: The graph below shows UK acid rain emissions, measured in millions of tones, from four different sectors between 1990 and 2007.
--> A: The line graph compares four distinct sectors, namely electricity, gas and water supply, transportation and communication, domestic, and other industry in the UK in terms of amount of acid rain emissions that they produced over a period of 17 years.
Overall, it is clear that the amount of acid rain emissions in the four given sectors declined considerably during 1990 and 2007. The most dramatic decrease was seen in electricity, gas and water supply.
In 1990, electricity, gas and water supply produced the highest amount of acid rain emissions, at about 3.2 million tones. With approximately 2.1 million tones of acid rain emissions, other industry's number is just lower than that of electricity, gas and water supply. The figures for transportation and communication and domestic were much lower, just around 0.7 million tones and 0.6 million tones respectively.
By 2007, there was a significant fall in the amount of emissions coming from electricity, gas and water supply to only 0.5 million tones, a decrease of almost 3 million tones. Similarly, emissions that came from domestic and other industry decreased gradually (0.2 million tones and 0.3 million tones respectively). In contrast, transportation and communication saw a slight increase, reaching a peak of 1 million tones in 2005 and then went back to its former level at 0.6 million tones in 2007.

Graph from the question
