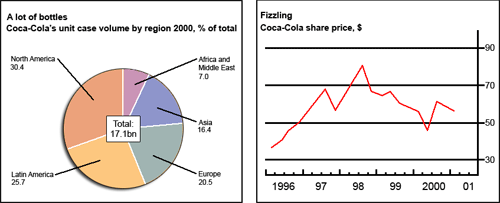
The pie chart illustrates the cosmopolitan distribution of Coca Cola's sales in the year of 2000 and the graph shows Coca Cola's share price in dollars from 1996 to 2001.
According to the pie chart of 2000, the total Coca Cola's sales number is 17.1 billion dollars. The product was the most desirable in North America since it occupies 30.4 percent of the pie chart. The following continents are Latin America and Europe which purchases 25,7 percent and 20,5 percent out of the Coca Cola's total revenue respectively. The last 2 continents are the modest consumers, Africa and Middle East, both have comparatively low percentage, specifically, 16,4 and 7,0.
There is a huge fluctuation when it comes Coca Cola's share price from 1996 to 2001. At the beginning, which is 1996, the share price was roughly 35 dollars. After that from 1996 to 1997, the price drastically increased to almost 70 dollars. Notwithstanding, the share price could not stabilize to mid-1997, it dropped to 60 dollars and then all of a sudden the price immensely rose from the mid-1997 to 1998 to approximately 85 dollars. From that point to 2001, the share price kept declining until 2000 , however it rose insignificantly from 2000 to mid-2000 compared to its best share price which is 85 dollars.
Any comments are welcome!

g1_1.gif
