Topic:
The pie charts illustrate coffee production and consumption in different nations as well as places coffee's revenues are contributed to.
Overall, while South America hold the greatest coffee production ratio, the main consumer is Central America. In addition, shippers enjoy the highest profit from coffee.
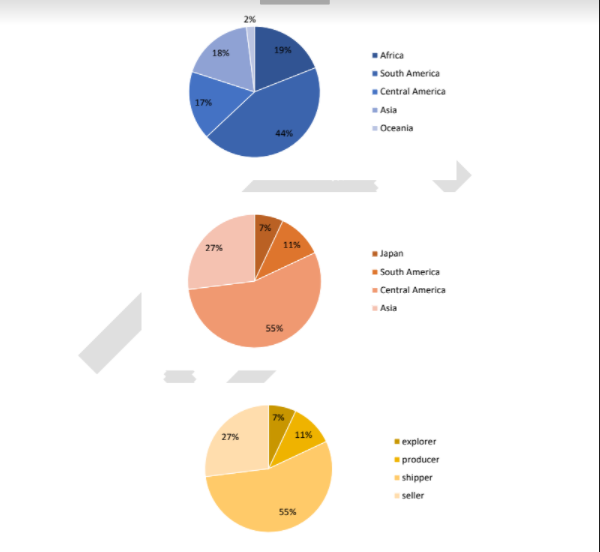
In term of production, South America's proportion dominates over that of the rest with 44%, followed by Africa, Asia and Central America, whose ratio are 17%, 18% and 19% respectively, leaving Oceania behind with the rate of 2%.
As for coffee consumption, Central America is the major consumer, taking over more than a half of the pie. Whereas Japan consume rate is the lowest, at 7%. Asia ranked second in utilizing coffee with 27% and 11% is that of South America.
Regarding revenue generated from coffee, shippers benefit greatly from it, occupies 55% of the total profit five times that of producer with 11%. Standing at the second place is seller with 27% of profit being generated form coffee products, nearly 4 times that of explorer.
The pie chart below shows information about where coffee is produced, consumed and where is profit goes
The pie charts illustrate coffee production and consumption in different nations as well as places coffee's revenues are contributed to.
Overall, while South America hold the greatest coffee production ratio, the main consumer is Central America. In addition, shippers enjoy the highest profit from coffee.
In term of production, South America's proportion dominates over that of the rest with 44%, followed by Africa, Asia and Central America, whose ratio are 17%, 18% and 19% respectively, leaving Oceania behind with the rate of 2%.
As for coffee consumption, Central America is the major consumer, taking over more than a half of the pie. Whereas Japan consume rate is the lowest, at 7%. Asia ranked second in utilizing coffee with 27% and 11% is that of South America.
Regarding revenue generated from coffee, shippers benefit greatly from it, occupies 55% of the total profit five times that of producer with 11%. Standing at the second place is seller with 27% of profit being generated form coffee products, nearly 4 times that of explorer.

IELTSWritingTask1.png
