Hello, im mei. Here is my very first post in this site.
Here is the writing that I've written to address the details of the figures. Would you please let me know your comments? Your strong feedback will be very helpful for revising my essay. Thank you in advice.
Question:
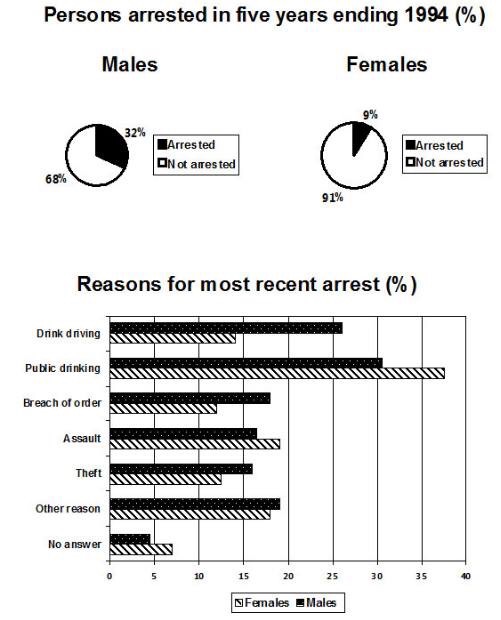
The pie chart shows the percentage of person arrested in the five years ending 1994 and the bar chart shows the most recent reasons for arrest
The pie chart compares the percentages of the criminal joined in prison for five years until 1994. In terms of the gender, and the bar chart provides information about the cause why they arrested. Over all, it is evident from the data that male prisoner predominate over over the female, and also public drinking was considerably higher than all other reasons of arrest both gender.
In detail, the total of men arrest was four times higher than women, 32% and 9% respectively. For both genders, more than a third of them got in prison because they drank in public. In this case, men lead the number with around 5-6% differences from women. Drinking while driving was the secondary highest reason for male to jailed, over than a quarter of total, compared to approximately 14% for female.
Besides, all the other reasons considerably lower than 20%, such as bench of other, assault, theft, and other reasons. Moreover, give no answer was the least reason, lower than 10% for both ganders.

The combine chart
