Writing Task I
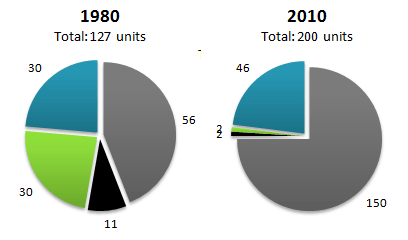
The pie charts below show electricity generation by source in New Zealand and Germany in 1980 and 2010.
The comparison of electricity productions by original sources in New Zealand and Germany during three-decade periods is revealed in the pie charts. Overall, both countries experienced a fluctuation trend in electricity produces between 1980 and 2010. Then, as can be seen, that New Zealand was the major of coal production during the years which became the highest rather than the production of Germany in 2010, but contrary the nuclear was totally produced in Germany during the periods.
As can be seen that, there are four main productions of electricity sources are provided in New Zealand, where in Germany has five electricity sources. According to the results, in New Zealand there are two main resources included hydro and coal which rose gradually during the years by approximately three times for coal and by 16% for hydro sources between 1980 and 2010. While, in Germany, both of those production sources saw a steady trend for coal and fell sharply in hydro sources by one in twenty.
On the other hand, both of natural gas and petroleum original sources in two countries saw a fluctuation trends. In New Zealand, the production of natural gas experienced a dramatic fall by 28%, and the petroleum productions also dropped in 2010. These conditions were similar to Germany, where both of petroleum and natural gas also witnessed a significant drop in 2010. (226 words)

Incomplete Picture
Complete Picture
