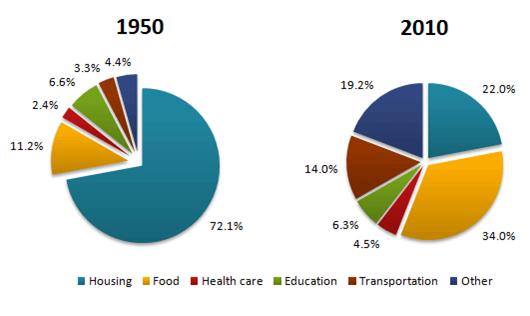
The pie charts below show the average household expenditures in a country in 1950 and 2010
A comparison of the proportion of domestic spending in a country in two different years, 1950 and 2010 is illustrated in the pie chart. Overall, there was a different trend in two years of the period. The percentage of the food expenditure experienced a significant increase, while the housing expenditure decreased sharply from 1950 to 2010.
In 1950, the household expenses were dominated by spending on housing, less than three-quarters of all household expenditures. However, in sixty years later, housing expenditure decreased dramatically to more than a fifth of the total. In contras, food expenditure in 1950 was at more than one in ten, then in 2010, increased significantly to more than a third of the total. It was followed by other expenses which also increased dramatically, from 4.4% to 19.2%.
Three other expenditures, health care, education and transportation, saw a less change. Those expenditures still remained stable at around less than a fifth, Education expenses from 6.6% to 6.3%, Health care expenditure from 2.4% to 4.5%, and Transportation spending from 3.3% to 14.0%.

The_pie_charts_below.jpg
