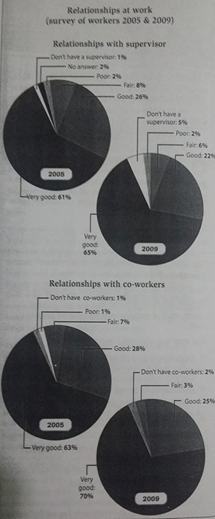
The chart below show the results of surveys in 2005 and 2009 asking workers about their relationships with their supervisors and their co-workers.
Writing Task 1, Unit 7D, Page 46
The breakdown of the information about the bond of employees with their supervisor and their co-workers are compared in pie charts. It is measured in the percentage, in 2005 and 2009. Overall, the most obvious facts that is the correspondent gave the largest figure of 'very good' answer in every bond at workplace during the year given.
To begin with, in relationships with supervisor, the largest starting proportion was 'very good' at 61% in 2005. It was followed by 'good' quantity at 26%, although there was a slight decrease of 4% in 2009. The figure of 'very good' rise to roughly 65%. Meanwhile, the percentage of no answer disappeared in 2009 and there was a fall in 'fail' figure by 2%. In contrast, the worker who did not have a supervisor increased from 1% to 5%.
On the other hand, the connection between workers and co-workers had a great rise in the figure of 'very good' of 7% over four-year period to 70%. In contrast, there were a decline in the percentage of 'good' and the percentage of 'fair' by 3% and 4% successively. Meanwhile, the rest parts had only a tiny proportion above 3% in the year given. (199 words)

289061_1_o.png
