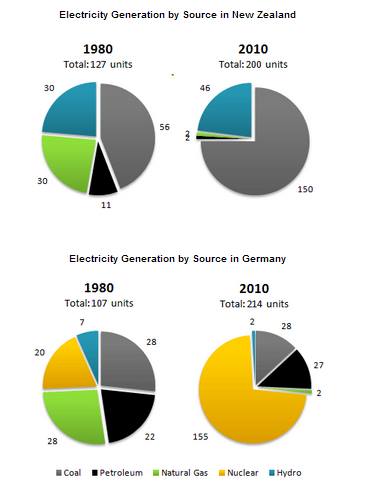
The pie charts below show electricity generation by source in New Zealand and Germany in 1980 and 2010.
A comparison of total units of electricity generation by source between 1980 and 2010 covered by units in New Zealand and Germany is revealed in the four pie charts. Overall it is immediately apparent that New Zealand and Germany had four and five sources of electricity generation respectively. Besides, in 2010, there was a rapid incline of total of unit for each countries which coal dominated in New Zealand while Nuclear was main source In Germany.
To begin with, between 1980 and 2010, there were a significant rise for each units. In New Zealand, the number of hydro and coal increased extremely by 16 and 94 respectively. Differently, the number of hydro decreased steeply and coal was stable at five and 28 unit's particularly in Germany. Besides, Germany had nuclear as the biggest sources which rose rapidly to 155 units in 2010. And it was higher than coal as a major source in New Zealand in 2010.
On the other hand, from 1980 to 2010, there were an extreme fall for each units. Natural gas and petroleum dropped sharply with similar number to two units in 2010 in New Zealand. Similarly, in Germany Natural gas declined extremely by 26 while coal inclined steeply to 27 units. In addition, natural gas in Germany and New Zealand had the same number in 2010, but petroleum in New Zealand was lower than in Germany in 2010.

question
