Hello, this is my IELTS writing task 1. I have practiced writing this task recently. Please read it and give me some advice to improve my skills. Any feedback is highly appreciated. The topic is in the attached picture. Thank you very much
.
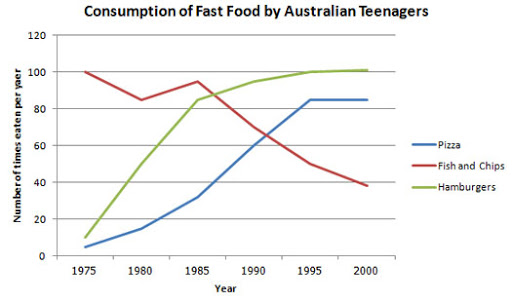
The line graph compares the consumption of three kinds of fast food by Australian teenagers: pizza, fish and chips, and hamburgers. The period time shown is 1975 to 2000.
Overall, both hamburgers and pizzas consumption increased dramatically over 25 years while there was a considerable decline in the number of times fish and chips were eaten.
In 1975, fish and chips were consumed most with 100 times, then followed by a decline to a little more than 80 times in 1980. Between 1985 and 2000, fish and chips consumption decreased sharply from 95 times to fewer than 40 times, becoming the type of fast food that was eaten least by 2000. In contrast, over the time shown, there was a tenfold increase in consumption of hamburgers from 10 times in 1975 to 100 times in 2000, whereas the number of times Australian teenager ate pizza in 2000 was sixteen times as many as in 1975. Originally having the lower times eaten compared to fish and chips, in the end, pizza and hamburger outstripped fish and chips completely. The period from 1995 to 2000, both pizza and hamburgers remained stable.
.
TASK 1 IELTS_FAST FOOD CONSUMPTION
The line graph compares the consumption of three kinds of fast food by Australian teenagers: pizza, fish and chips, and hamburgers. The period time shown is 1975 to 2000.
Overall, both hamburgers and pizzas consumption increased dramatically over 25 years while there was a considerable decline in the number of times fish and chips were eaten.
In 1975, fish and chips were consumed most with 100 times, then followed by a decline to a little more than 80 times in 1980. Between 1985 and 2000, fish and chips consumption decreased sharply from 95 times to fewer than 40 times, becoming the type of fast food that was eaten least by 2000. In contrast, over the time shown, there was a tenfold increase in consumption of hamburgers from 10 times in 1975 to 100 times in 2000, whereas the number of times Australian teenager ate pizza in 2000 was sixteen times as many as in 1975. Originally having the lower times eaten compared to fish and chips, in the end, pizza and hamburger outstripped fish and chips completely. The period from 1995 to 2000, both pizza and hamburgers remained stable.

unnamed.jpg
