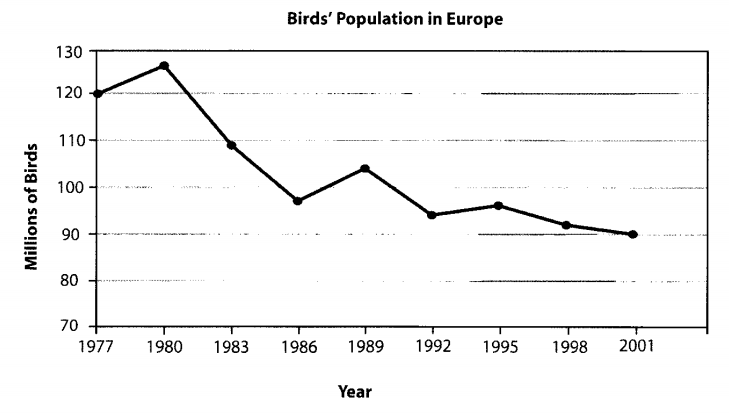
The graph below shows the birds' population in Europe from 1977 to 2001.
(This is a topic and the line graph is below )
The graph give data on the bird population has changed in Europe , during the span of 24 years period from 1997 to 2001. Overall, the number of birds decreased by 30 millions of the amount , in the early of the time span it was increased a bit but after that they were inclined to fell out dramatically in the latter one.
In 1997, the number of birds grew up approximately to 130 millions.Meanwhile , after that period they were tend to diminished by 99 percent of the total decreased amount in a dangerous way from 1980 to 1986. Thereafter , they accelerated to 7 millions quantity next 3 years . From the beginning of 1989 , they're continue dropped out and the number is lower than a previous period . In 1992 , the number of birds slightly increased by 2 millions . In the final 6 years , this number fell off from 96 millions to 90 millions.

birdspopulationin.png
