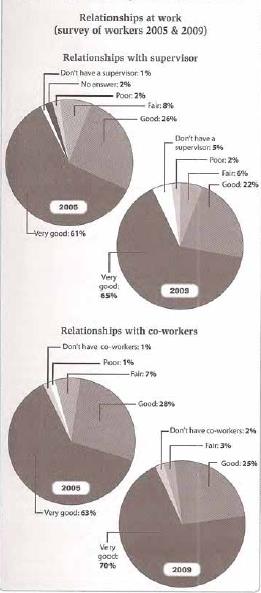
The charts below show the results of surveys in 2005 and 2009 asking workers about their relationships with their supervisors and their co-workers.
Summarise the information by reporting the main features, and make comparisons where relevant.
The pie charts illustrate the percentage of employees' relationships data with their board and their associates between 2005 and 2009 and it was divided in several levels of relationship. Overall, it can be seen that very good level took the first place in all kind of relations in both period. While there were under very small numbers in poor and do not have supervisors or co-workers' bond over 4-year period.
According to the data, in 2005 the results of both type relations showed the biggest proportion in very good level, which were just over three-fifths. Good bond categories also had similar proportion at just above a quarter in the relation between workers and not only their managers also their colleagues. On the other hand, fair level stood far less than good relation over both bond categories at small number while there were also under one in twenty in the percentages of poor and work alone categories. Interestingly, employees had no answer the survey about their relationship with their bosses which was 2%.
Meanwhile, over 4-year following the very good bond level still placed in first place at 65% (connection with their managers) and 70% (interaction between their partners in office) which were following by good relation in second place in both types of relations at 22% and 25% each for interaction of bosses and associates respectively. Whereas, there was proportion that got just under 10% in fair, do not have supervisor and friends in company and poor connection categories.

PIECHART2.jpg
