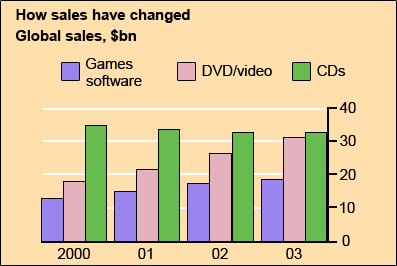
The chart illustrates the global sales of games software, DVD, CDs. Overall, we can see some substantial vicissitudes for DVD and games software since the total revenue obviously were erecting during in those entire 3 years of record, but not in CDs.
By looking at the graph, we can see that from 2000 to 2001 the games software increased its sales for approximately 2 billion dollars and the DVD for roughly 3 billion dollars, in sharp contrast to these 2 utilities, the CDS decreased its price for 1 billion dollars. Those numbers did not stop altering after 2 years, the total revenue of games software kept growing to 19 billion dollars and its partner DVD to more than 31 billion dollars, in the meantime, the CDs reluctantly dropped to 32 billion in 2003.
The data suggest that, as time goes by, more and more individuals prefer games software and DVDs over CDs.
I find it difficult to protract my essay when it comes to Writing task 1. Any advice would be appreciated!

g2.gif
