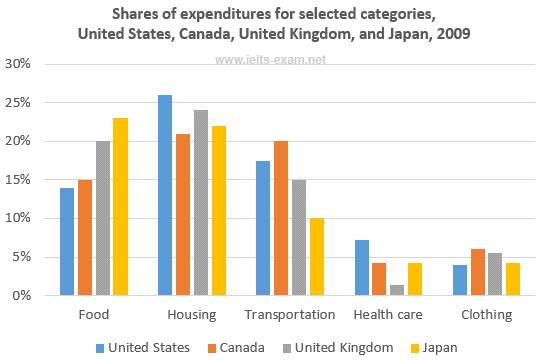
The bar chart below shows shares of expenditures for five major categories in the United States, Canada, the United Kingdom, and Japan in the year 2009
A breakdown of expenditures' usage in some of countries of three continents in 2009 is depicted by using bar graph. Overall, housing had the most enormous average in four countries and also contained United States who had the greatest value among all. Meanwhile, Health placed as the smallest grade among all, even had the United Kingdom that had the tiniest percentage. In addition, clothing's spending was almost same in four countries.
It is clear that all countries' inhabitants spent most of their salaries for their home. The United States positioned as the top among all at more than 25%. It was followed by the United Kingdom, Japan, and Canada, and each of them still hit more than 20%. Then, Japan became the largest state that used their money for meals. It was shown by the percentage at about 23%, while the United States that had the biggest percentage before, placed as the lowest in food at just below 15%.
Next, transportation had the highest value in Canada at 20% while the lowest was Japan at half of it. In the last position, it was placed by health care and clothing. Each of them had different country who placed as the largest. While the first one was placed by the United States at about 7%, the second one was positioned by Japan at lower by 1% compared with before. It also can be seen that people that spent their money for clothing almost same that was proven by the small different between all countries that no more than 3% respectively.

15241778_10202218279.jpg
