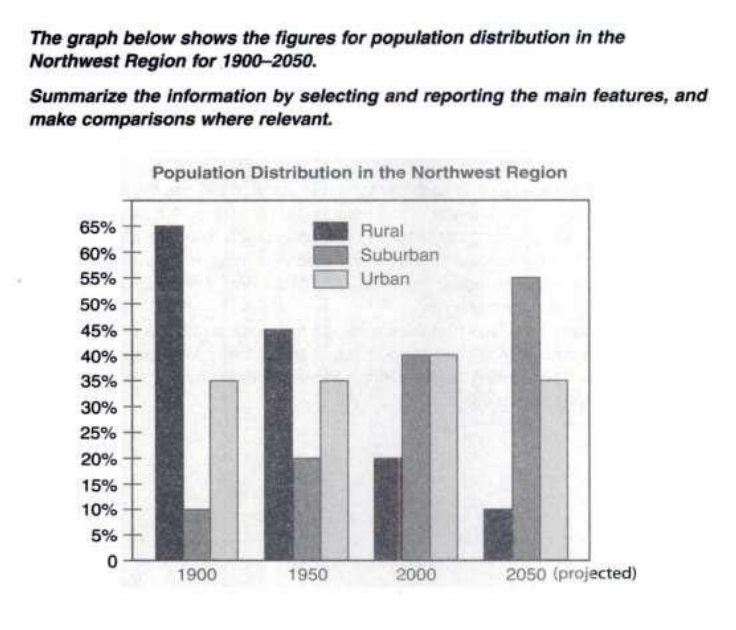
The bar chart gives information about the percentage of distribution of population in three areas of the Northwest region (urban, suburban and rural) in 1900, 1950, 2000 and an estimated percentage in 2050.
Overall, there was a significant increase in the proportion of people who live the suburbs over 1900 and 2000. In contrast, the percentage of people who lived in the rural areas considerably decreased, while the percentage of urban population was more or less stable. The highest percentage of population was in the rural area in 1900, however, it is predicted that this percentage will be the lowest in 2050. Eventually, this percentage will be strikingly similar to the percentage of population in the suburban regions in 1900.
Although people in the past tended to live in the countryside, their tendency significantly changed through time to settle in the suburban area of the Northwest region. In 1900, the percentage of population was 65% in the rural area. Then, it went down to 20% in 2000, while, in the suburbs, the population was 10%. Then, it steadily went up until it reached 40% which is the same percentage of population in urban area in the same year. The urban area witnessed a minimal growth of about 10% compared by percentage of 1900 and 1950.
By 2050, it is expected that the population will reach approximately 55% in the suburban area, while it is forecast to fall down to 10% in the rural area. Concerning the urban area, the population will be similar to the one of 1900 and 1950, which was about 35%.

ielts_task_1.jpg
