IELTS TASK 1 - A SURVEY OF HAPPINESS LEVELS BETWEEN MARRIED AND UNMARRIED AMERICAN
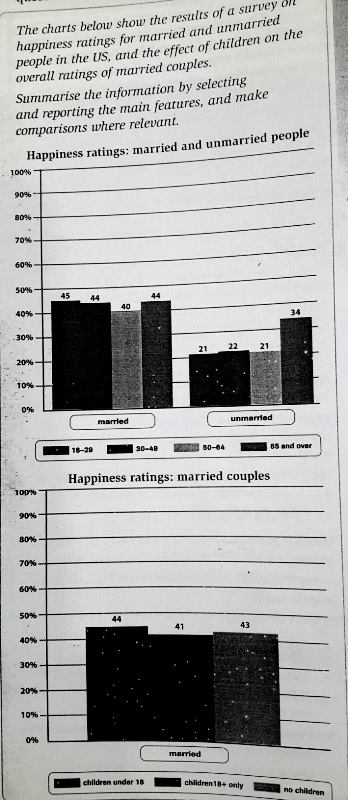
The line charts provide the information of a survey which compares the happiness levels between married and unmarried American as well as the effect of possessing children. Overall, it can be noticed that happiness ratings of married people are higher than single ones. In any case, the proportion of happiness between married couple who have or having no children is almost same.
A more detailed look at the first graph reveals the differences of happiness ratings for married and unmarried groups. The 18-29 age group is the highest level in married range groups at 45%. Married people aged 30-49 and the ages of 65 and over have similar proportion at 44% while the 50-64 aged group shows the lowest blissfulness levels in married category at 40%. Furthermore, unmarried people experience the happiness levels for three age categories except the people who are 65 years old or over at 34%.
Moving to the other chart, the largest proportion of blissfulness ratings is experienced by people who have married and possess children under 18 at 44%. People who have family but do not have children follow at 43% whereas 41% of all couples who only own children 18 years old witness the lowest percentage of happiness levels.

262487_1_o.jpg
