The bar chart report
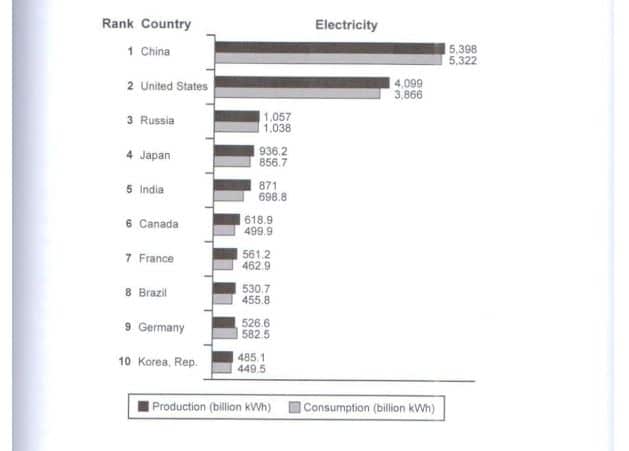
Prompt: The bar chart below shows the top ten countries for the production and consumption of electricity in 2014.
Summarise the information by selecting and reporting the main features, and make comparisons where relevant.
Response:
The given bar chart illustrates the amount of electricity produced and consumed, in kWh units, in the top ten countries - China, the US, Russia, Japan, India, Canada, France, Brazil, Germany, and Korea by the year 2014.
A glance at the chart reveals that China was generating and using the maximum amount of electricity while Korea was doing the opposite. Production of electricity was higher than consumption in all of the nations except Germany.
In terms of production, China was clearly ahead of all the other countries, producing 5398 billion kWh. As this number dropped slightly for the US, at 4099, it secured the second position for the US in the list. There was a dramatic reduction in the amount of generated electricity for Russia, Japan, and India which was 1057, 936, and 871 billion units respectively. While keeping similarity among them, the remaining countries produced electricity in the lowest quantity ranging from 485-618 billion units.
Regarding the consumption of current, a similar characteristic is shown by all the countries. China and the US was at the first and second position respectively in this category too by using 5322 and 3866 billion units of current. Meanwhile, the usage of electric goods were very low for other countries ranging from 449-1038 billion kWh. Despite generating different amounts of current in each nation, all of them were able to meet their needs except Germany which produced less energy in the form of electricity than it consumed.
Can you please suggest me expected band for this task?

task1cam13test3.jpg
