Unanswered [0]
  

Home / Writing Feedback   % width   Posts: 6


IELTS: Expenditure on fast food by Income groups in UK; hamburger and pizza


SHanafi 120 / 357  
Mar 23, 2014   #1
Hello friend, I am preparing for IELTS exam, please kindly check my writing. Thank you :D

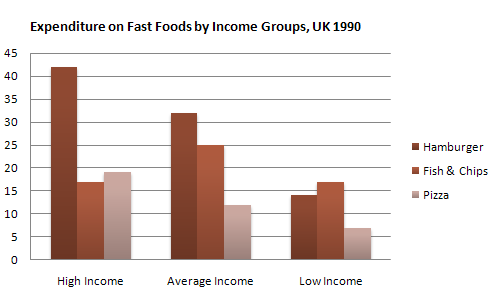
The bar chart gives information about the amount of money of high income, average income and low income people in Britain spent on fast foods during a period of time in 1990.

Overall, hamburger and pizza experienced a gradual decrease in case of Briton expenditures, as opposed from both figures there was a fluctuation in amount of Britain expenditure to buy pizza.

Turning to the details, as 17 pounds high earners expended to buy pizza, then this trend experienced a gradual decrease by 12 pounds in average earner to low of 10 pounds lower earner expenditure. Similarly, the hamburger experienced a gradual decrease in the different amount of expenditure. Starting with the highest earners expenditure by more than 40 pounds, this trend declined steadily in average earner by 33 pounds then continued felt to less than 15 pound expended by the lower earners.

A more detailed look at the chart compared that the overall Britons earner groups of fast food expenditure in amounts was not always similar. The lower earners took fish and chips as the most favourite by 17 pounds expenditure while hamburger coming second by 14 pounds then followed around 7 pounds expenditure to buy pizza. Meanwhile, statistic for high earner and average earner recorded hamburger as the high expenditure by more than 30 pounds whilst fish and pizza stood as the least favourite by both groups by under 20 pound Britons spent to buy them.

  • Expenditure_on_fast_.gif


codeblue 5 / 9  
Mar 23, 2014   #2
Hi. I think you should use diff. vocabularies. for example, you use the word "gradual " and decrease more than once. there are a many similar words for them. Enhance your vocabulary , use words like consumption, accounted for, and i think your usage of numbers should be limited.
dumi 1 / 6793  
Mar 23, 2014   #3
The bar chart givesprovides information about the amount of money ofspent by high income , average income and low income people in Britain spent on fast foods during a period of time in 1990.

Overall, hamburger and pizza experienced a gradual decrease in case of Briton expenditures, as opposed from both figures there was a fluctuation in amount of Britain expenditure to buy pizza.

... the highlighted part is pretty confusing. This is what I suggest;
Also, this is very wrong as an idea. Why do you say hamburger and pizza had a gradual decrease? These are the figures only for 1990 and we do not have any information about increases or decreases. Do not present any information that is not depicted by your graph or chart. What is presented by this chart is the money spent on those three food items by three different categories.

Overall, both high and average income earners have spent on hamburgers over the other two food items while the low income earners have spent more on fish and chips. Further, both average and low income earners have spent least on pizza over the other two items while the high income category has spent on fish and chips the least.
MisterWandering 18 / 314  
Mar 23, 2014   #4
Overall, hamburger and pizza experienced a gradual decrease in case of Briton expenditures, as opposed from both figures there was a fluctuation in amount of Britain expenditure to buy pizza.

"Decrease" and "Increase" are used to describes changes of a subject with times. However, in this essay, you have to compare expenditures of three groups of people so comparative and superlative adjectives should be used.
eddies [Contributor] 25 / 1170  
Mar 23, 2014   #5
Expenditure = money spent
High/average/ low income = people in the high/average/low-income group

Dumi has helped you working with the introduction. Also, I represent an alternative viewpoint from the intro. Hope these two samples help :D
The bar chart shows weekly expenditure on the three types of fast foodgives information about the amount of money of high income, average income and low income people in Britain by food and incomespent on fast foods during a period of time in 1990.

you have to compare expenditures of three groups of people so comparative and superlative adjectives should be used.

Yes, I couldn't agree more.

Here are the examples:
Pizza was the least favorite food / the least favorite food was Pizza
Fish and Chips was the most popular food with the low-income group/ The most popular food with the low-income group was Fish and Chips

How to make comparisons
more + noun + than
adjective + er + than
fewer + noun + than
more/ less + adjective + than
the most/least + adjective
the + adjective + est
as many ... as
not as many ... as
MisterWandering 18 / 314  
Mar 27, 2014   #6
The bar chart shows weekly expenditure on three groups in Britain by food and incomeduring 1990

The bar chart compares the expenditure of three income groups of Britain on three types of fast foods in 1990.

Overall, both high and average earner have spent on hamburger over the other two food items while low earner have spent more on fish and chips

Overall, hamburger was the most popular fast food of both high and average income groups while low income group spent more on fish and chips than the other two foods.

Turning to the details, fish and chips consumption varied markedly.

,

A more details looked at the bar graph reveals that the group earner expenditure on fast food in amount was not always steady.

I don't think you should use these sentence on all essays because they are not appropriate with all given charts.


Home / Writing Feedback / IELTS: Expenditure on fast food by Income groups in UK; hamburger and pizza
ⓘ Need Writing or Editing Help?
Fill out one of these forms for professional help:

Best Writing Service:
CustomPapers form ◳

Graduate Writing / Editing:
GraduateWriter form ◳

Excellence in Editing:
Rose Editing ◳

AI-Paper Rewriting:
Robot Rewrite ◳