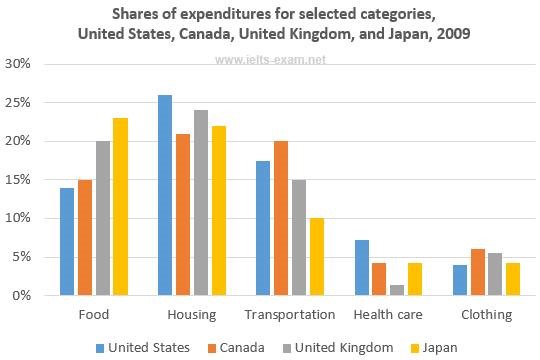
A breakdown of the information about the proportion of expenditures allocated for five predominant categories in four different developed countries in 2009 is illustrated in the bar chart. Overall, it can be seen that only Japanese spent most expenses on refreshment while others invest their most expenditures in housing.
Firstly, USA had the highest housing spending share, just over a quarter in 2009. It was followed by United Kingdom and Japan by just below 25% and around 23% respectively. Canada was the lowest among the three. In contrast, Canada had the largest proportion in transportation while the others just below a fifth. Japanese was more likely to invest most of their income for refreshments rather than for housing and transportation.
Surprisingly, each countries spent a minority of expenses on healthcare and clothing, just below 10% in all countries. Only japan allocated a similar amount of expenditures for healthcare and clothing. The other proportion is unsurprisingly proportion.

task_1__04.jpg
