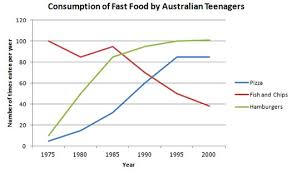
The breakdown of information about the junk food eaten by young people from Australia over 25-year period is depicted in the line graph. It is measured by the number of times consumed every year. Overall, the main fact that stands out is that Pizza and Hamburgers showed a dramatic growth while Fish and Chips dropped dramatically over the timeframe shown.
Initially, Pizza and Hamburgers began at fairly similar levels, which stood at around 15 and 13 respectively. Both of them then increased significantly to 82 for Pizza and 100 for Hamburgers in 1995. From 1995, Pizza then leveled off whilst Hamburgers rose slightly in the end of the period.
On the other hand, Fish and Chips started at 100 consumption of fast food in 1975, the highest than two other snacks. Subsequently, it experienced a fluctuation until 1985, and it was followed by a sharp fall, which hit a low of just under 40, the lowest in the end of the timespan.

download.jpg
