Unanswered [1]
  

Home / Writing Feedback   % width   Posts: 6


The figure illustrates the number of three kinds of fast food eaten by youths in Australia


sehatdinati 7 / 21  
Feb 18, 2017   #1
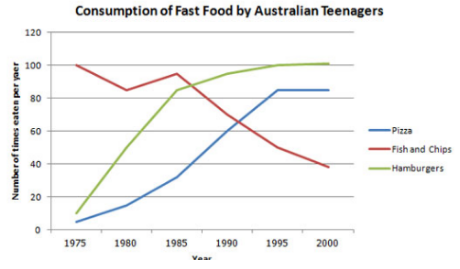
The line graph below shows changes in the amount and type of fast food consumed by Australian teenagers from 1975 to 2000.

pizza, fish and chips, and hamburgers - which are more preferable among teens?


The figure illustrates the number of three kinds of fast food (pizza, fish and chips, and hamburgers) which were consumed by Australian youth from 1975 to 2000. Unit are measured in number of times eaten per year.

Overall, the consumption of fish and chips decreased over period given, while for pizza and hamburgers, they rose. At the start of the period, fish and chips was the most popular junk food, which was replaced by hamburgers from 1985 to 2000, and followed by pizza became the second most widely consumed fast food since 1990 until 2000. With regards to the amount of fish and chips eaten, it peaked at around 100 portions per year in 1975 before falling sharply to about 41 portions per year in 2000. Likewise, approximately 15 pieces of hamburgers were consumed in the first year after which the figure rocketed, climbed minimally, and remained constant 100 pieces from 1995 to 2000. On the other hand, the consumption of pizza only started in 1975 at nearly 10 slices. This graph, which increased sharply and stabilised over 80 slices since 1995 until 2000.

In brief, as it presented in the line graph, number of times pizza and hamburgers eaten was a dramatically increasing in 2000 compared to 1975, while eaten number of fish and chips is dropped gradually from 1975 to 2000.

  • WT1_Consumption_Fast.png


foyuliu 5 / 20  
Feb 18, 2017   #2
You wrote 223 words, probably exceed the words limit, it is 150 words, right? Please consider to reduce the body paragraph a little bit.

I will try to re-write the summary paragraph.

In brief, as it presented in the line graphs, number of times pizza and hamburgers eaten was a dramatically increasing in 2000 compared to 1975, while eaten number of fish and chips is dropped gradually from 1975 to 2000.

In brief, it can be seen that more Australian teenagers tend to consume pizza and hamburger these days, and that fish is much less popular than before.
Holt  Educational Consultant - / 15466  
Feb 18, 2017   #3
Sehat in the opening statement. Do not put the food choices in a parenthesis. These are integral parts of the information provided in the line graph and should therefore, be represented in a completely developed sentence as well. Now, with 223 words, you are well within the limits of the word requirement.

Congratulations on being able to write more than the 150 word minimum in a manner that showcases your writing abilities and analytical skills. Word of caution though, make sure to use the correct plural form for words. For instance, "unit" should have been written as "'units" because it pertains to a high number of food consumers, hence the plural form.

By the way, your second paragraph is running too long. You have to divide that into 2 statements in order to make easier to read and avoid stressing out the reader due to the lack of spaces between sentences. You could have easily developed a very interesting 4 paragraph statement. However, doing so would have required you to create more interesting paragraphs. Which means you would have to analyze the data more in order to write pertinent information for the reader. I know, it sounds difficult, but if you pull it off, you will end up impressing the examiner because of your task accuracy and grammar range accomplishments. Overall, not a bad essay. It might get a 5 easily in the actual test scenario.
akbarmappiare 31 / 445  
Feb 18, 2017   #4
Hi Sehat, I have read your writing task 1 closely. In this moment, I am gonna offer a few suggestions about your content.
Firstly, you have missed one of requirements for creating a paragraph. Kepp in your mind that the good paragraph has at least 3 sentences. Actually, you could place your overview in the first paragraph so that you can meet the requirement. To obtain a higher score, you should ensure that your overview described a smoother information. I mean that you can convert your data into the real information avoiding the word of changes. If you wanna impress the examiners for getting the high score, you create the more overview by using comparison language.

Turning to the body paragraphs, there was an odd thing. The first body paragraph was too long, and another paragraph is short. I think you need learning a grouping technique.Besides that, I only remind you that your job in the writing task 1 is to compare figures, not inform the data separately. It will be not appealing. To know about that technique deeply, I highly recommend you for reading more examples of the writing task 1.

Practicing more and more is the key to master this skill. GOOD LUCK
MH_tw 4 / 5  
Feb 18, 2017   #5
I think the problem of the second paragraph is too long and there is no specific thing that you try to describe.
You mention too much details in one paragraph.
OP sehatdinati 7 / 21  
Feb 18, 2017   #6
@foyuliu

Dear @Foyuliu, 150words is the minimum words, not the maximum.

Thankyou, anw!


Home / Writing Feedback / The figure illustrates the number of three kinds of fast food eaten by youths in Australia
ⓘ Need Writing or Editing Help?
Fill out one of these forms for professional help:

Best Writing Service:
CustomPapers form ◳

Graduate Writing / Editing:
GraduateWriter form ◳

Excellence in Editing:
Rose Editing ◳

AI-Paper Rewriting:
Robot Rewrite ◳