Would you please give me some comments for my article. I am not very good at English so please point me out if I made any mistake.
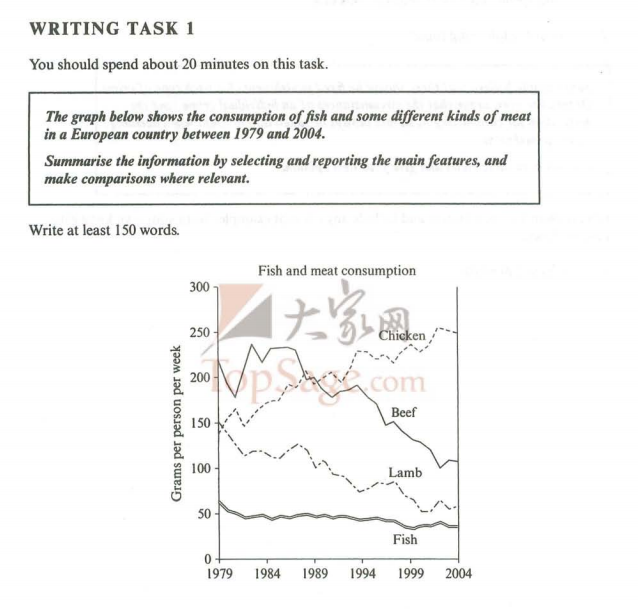
The graph shows the consumption of fish and different types of meat in a European country in 25 years.
Generally speaking, chicken, was the only type of meat that had a rose in consumption, whereas other kinds of meat including fish, recorded a fell in numbers.
In 1979, beef was the most consumed but it was substituted by chicken in 1989. There was a significant drop for beef, from about 225 grams in 1979 to only 100 grams in 2004. On the contrary, the consumption of chicken rose rapidly, from approximately 150 to 250 grams through one-fourth of a century.
The consumption of lamb, like the situation of beef, was decreased gradually. In 1979, it was the second-most consumed meat and it ranked third after 25 years.
Fish was the least consumed meat in the country. Although fish is unregarded, it received a slight fall too. In 1979, every citizen ate about 60 grams of it every week. After 25 years, they ate 20 grams less.

173400_1_o.png
