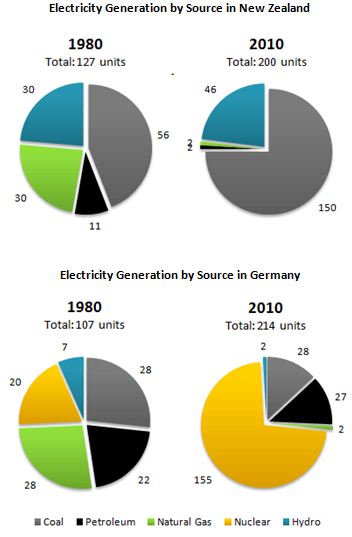
The pie charts below show electricity generation by source in New Zealand and Germany in 1980 and 2010.
A breakdown of the information about five different sources that can produce electricity in New Zealand and Germany is depicted in pie charts. It is measured in unit, in 1980 and 2010. Overall, the most obvious facts are that Coal was the most popular source in New Zealand while Nuclear, Natural Gas, and Coal were three main sources in Germany.
Initially, New Zealand did not use Nuclear as in Germany, and except Natural Gas and Petroleum, other sources had an upward trend. Coal number started at 36 and grew roughly threefold in 2010. In contrast with the figure for Natural Gas bottomed at 2 from a third. The quantity of Hydro rose slightly by 16 to 46 while petroleum saw opposite pattern at 2 in 2010.
Meanwhile, in Germany, 2010 witnessed a mark jump in Nuclear number that reached a peak at 150. Coal number remained unchanged at 28, and the figure for Natural Gas appeared to fall dramatically as in New Zealand at 2. There was a slight increase in Petroleum quantity at 5 while Hydro experienced to decline by 5 from 7 in 1980. (186)

Inter1.JPG
