Unanswered [2] | Urgent [0]
  

Home / Writing Feedback   % width   Posts: 2


The flow chart illustrates the way of disposing salt from sea water to produce drinkable one


phaa 1 / -  
Sep 2, 2020   #1

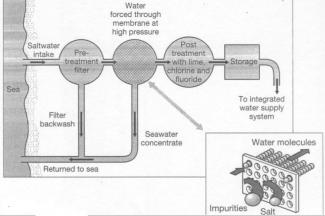
The diagram below shows how salt is removed from sea water to make it drinkable


The flow chart illustrates the way of disposing salt from sea water to produce drinkable one.
Overall, there are four main steps in the process, beginning with pre-treatment for seawater and ending with the integration stage
Initially, a huge amount of saltwater is pumped into the pre-treatment filter, where large impurities are removed via another filter before being piped back into the sea. Meanwhile, the remaining water is forced through a membrane at high pressure so that the other substances, as well as salt, are eliminated from water molecules and being returned to the sea together with the others mentioned before.

Although the first two steps are proceeded carefully, post-treatment with chemicals: lime, chlorine and fluoride are still necessary to ensure the highest quality of processed water. Finally, the desalinated one is stored at the factory until needed, which can be dispatched later to the integrated water supply system for public usage.

  • task1_1.jpg


Holt  Educational Consultant - / 15393  
Sep 3, 2020   #2
Try to create the proper formatting requirement for your presentation. Use 3 paragraphs to create the explanation. Make sure you have:
- a summary overview
- process 1 (first half)
- process 2 (last half)

That is how the diagram is laid out and that is how you should represent the description in your report. Although you wrote 152 words, your essay feels a bit stretched. Probably because you did not manage to create paragraphs that clearly show an integration of simple and complex sentences. It is important that you avoid run-on presentations and use at least 3-5 sentence per paragraph so that you can achieve your maximum GRA scoring potential.

Do not rely on continuous information presentation per paragraph. That creates confusion in the presentation. It makes it difficult for the reader to follow your topic presentation per sentence. Make sure you present only one process per sentence to ensure that you get a better C&C score.


Home / Writing Feedback / The flow chart illustrates the way of disposing salt from sea water to produce drinkable one
Need Writing or Editing Help?
Fill out one of these forms:

Graduate Writing / Editing:
GraduateWriter form ◳

Best Essay Service:
CustomPapers form ◳

Excellence in Editing:
Rose Editing ◳

AI-Paper Rewriting:
Robot Rewrite ◳

Academic AI Writer:
Custom AI Writer ◳