--------------------------IELTS TASK1 - similar to JULY 2009 , GREECE ------ See the photo attached (task 1 , diagrams).----- 20 MINUTES---
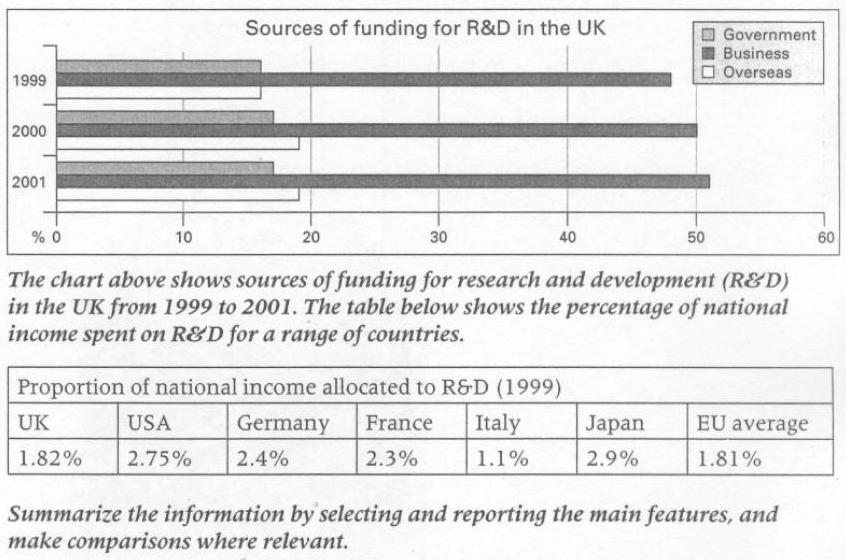
The chart illustrates how the funding for reseach and development was allocated throughtout the three-year period ranging from
1999 to 2001, in the UK.
From an overall perspective, it is obvious that businesses supply the R&D departments with the majority of all the funding that
they receive. Specifically, in 1999 approximately 50% of the funding for R&D came from businesses a lot more than what came
from government and oversees. The latter sources accounted fo almost 15% each, both half the business's contribution.
Noticeably, in 2000 the business contribution increased significantly while the government funding marginally increased. On the contrary,
oversees funding increased a bit under 5%, and remained the same in 2001, as did the government funding.
Interestingly, Uk's proportion of national income alloted to R&D was only sligtly above the EU average , but significantly lower than
that of Japan's (which ranks at the top) and Germany's. Evidently, UK's figures are a lot higher than those of Italy's yet they are
at a much lower level than USA's.
To sum up, while UK's proportion of national income allocated to R&D in 1999 ,is above EU average, it is interestingly much lower than
that of other developed European countries. In addition, businesses had larger share of funds given to R&D than that of government and
oversees combined.
----------
Could you please correct my mistakes ?
Thank you very much!

ielts1.jpg
