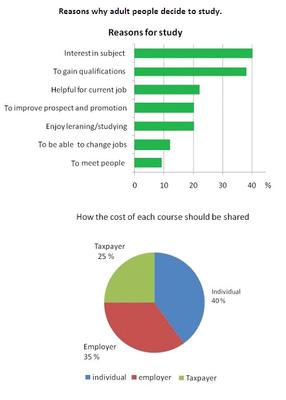
The given charts represent the consequences of questionnaire of teen erudition, thus initial chart headlines the main factors why young individuals make a decision to graduate, furthermore, the pie chart indicates public opinions about the prices of adult education and their share in it.
As it is seen, interest in subject leads the main role with 40% among applicants, likewise gaining qualifications hits less 2 points i.e. 38% of general decision. Other factors, such as helpful for current job, developing prospects of promotion and enjoyment of studying keeps 22 and 20% as they are showing the half amount of the first reason.
Being able to change jobs, and meeting new people, unfortunately, take last positions with 12 and 9%, however, these less regarding reasons play an indispensable role in socializing and begetting excellent experience on a daily routine.
Having a look to the costs which should be shared, people prefer to pay 40% of money for individuals and less 5% for employer. As usual, taxpayer is taken into consideration in the last position with 25% and these shares are considered as a fair division.

ieltsbarandpiech.jpg
