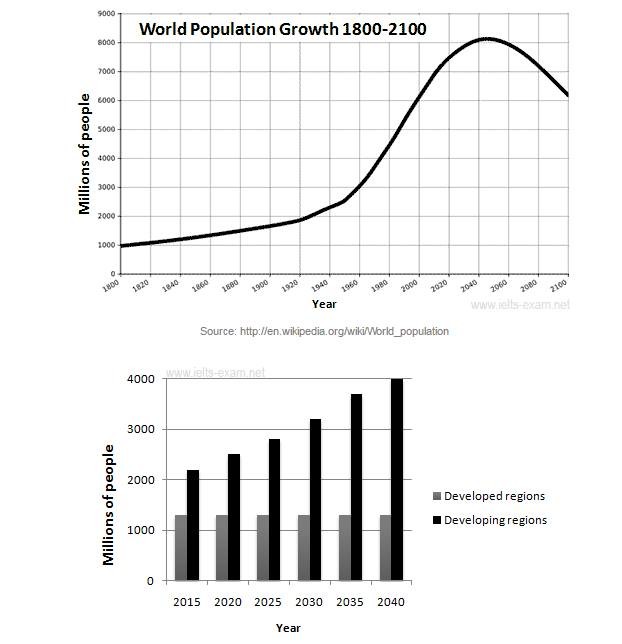
The graphs below provide information on global population figures and figures for urban populations in different world regions.
Summarise the information by selecting and reporting the main features, and make comparisons where relevant.
The line graph illustrates the increase of global people during 1800 and 2100, and the bar chart shows the number of people who occupy in inner city in developed regions and in developing regions between 2015 and 2040 and were measured in millions of people. Both of these graphs shows an inclining of the total number of people, but in developed regions the amount of urban population remained stable during the period.
From 1800 to 1940 there was a gradual growth in world-wide society from 1000 to 2100, but after these period, the number of population increased dramatically and will reach a peak at 2040, about 8000. And it will decrease slightly to finish the period at around 6100.
The bar chart gives information about the amount of citizen in urban area will increase significantly in developing countries, starts at 2100 to 4000 at the end of period. It will be almost two times from the beginning. In contrast, it will remain stable in developing countries about 1300 over the period.

World_Population_Gro.jpg
