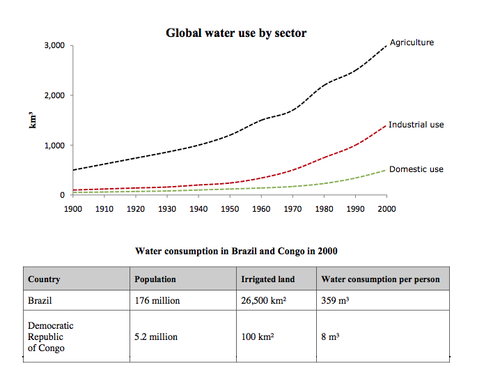
The world's water consumption in three categories during the period 1990 to 2000 is illustrated in the line graph, and the comparison between water usage in Brazil and Congo in 2000 is presented in the table. Units in the line graph are measured in km3. At the first glance, it is evident that the line graph forms an upward trend with the level of water consumption in agricultural showed the highest level. Moreover, it can also be seen clearly that Brazil consumed more water than Congo.
There was a dramatic increase in the number of water for farming. Furthermore, It broke the record as the biggest use until the end of period at virtually 3,000 km3. Similarly, started at almost zero point, the amount of water for both industrial and domestic use rose moderately. However, industrial purposes consumed water at over than twice more compared to domestic water consumption in 2000.
Turning to Brazil and Congo water consumption, with the rate of population at thirty times more than Congo, Brazil consumed more water both for land irrigation and personal use. Nevertheless, the Democratic Republic of Congo consumed a tiny number of water at 100 km2 in agrarian use and 8 m3 per person.

multi_1.png
