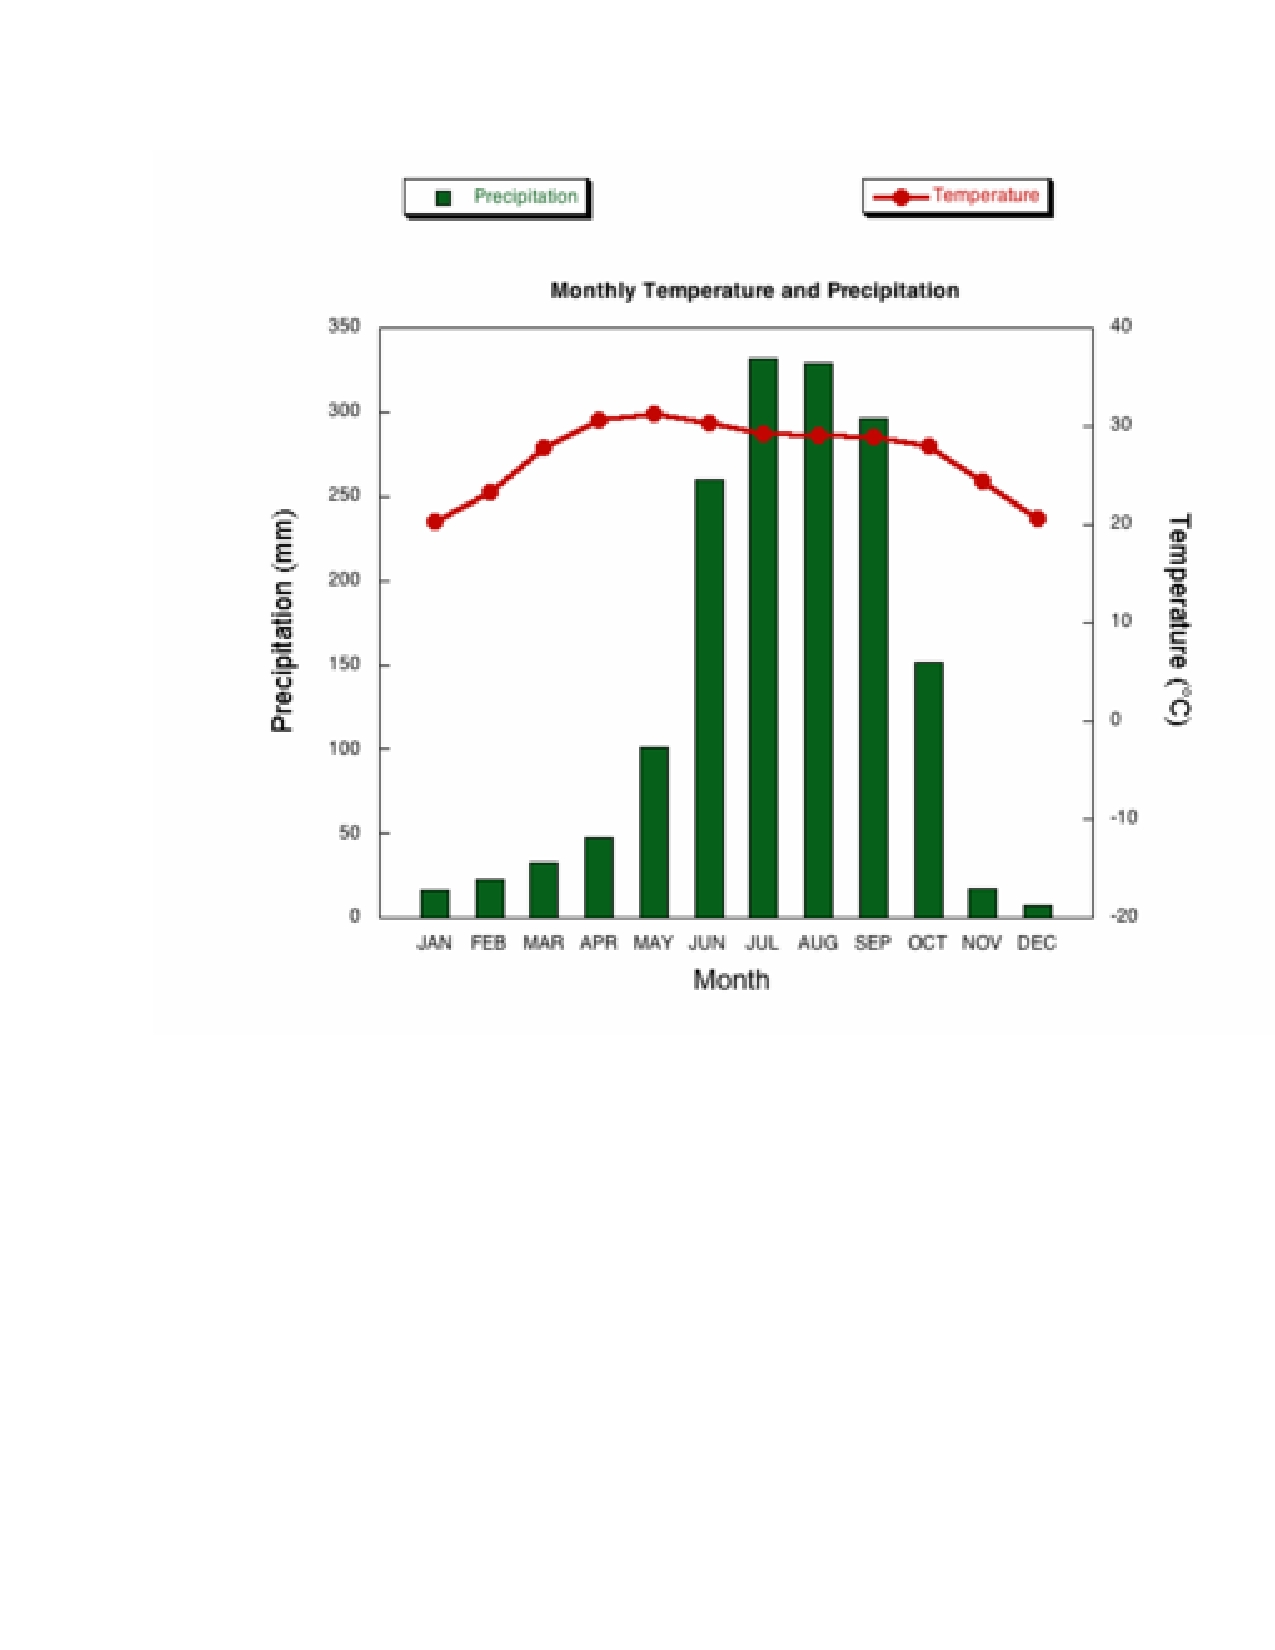
The climograph below shows average monthly temperatures and rainfall in the city of Kolkata (or Calcutta).
The given graph provides information regarding the average monthly temperature and rainfall of all months througout the year in the city of culcutta.
Turning to detail, the level of rainfall was slowly raised from 20mm in January to 50mm in April. It doubled in the following month. There was a significant increase of rainfall in the following two months, June and July. It shot up from 100mm to 250mm , a rise of 2.5 times in june and 330mm in july. It reached the peack and remained the same for the next month. Thereafter it showed a negative trend of decreaseing. In october in droppd to nearly half of the previous month's rain. In November and December it further declined and reached to 25mm and 20mm respectively.
In case of temperature also it showed an upward trend and it rose sigificantly from 20degree in January to 30degree in May, which was the peak. Then it slowly reduced slightly and remained the same for the next three months. The following three months it declined continously and reached the same maximum level as it was in January which was 20degree.
In short, in calcutta, the highest rainfall were experienced in the month of July and August lowest in december. The hottest month was May and the coldest were January and December.
The climograph below shows average monthly temperatures and rainfall in the city of Kolkata (or Calcutta).

A.jpg
