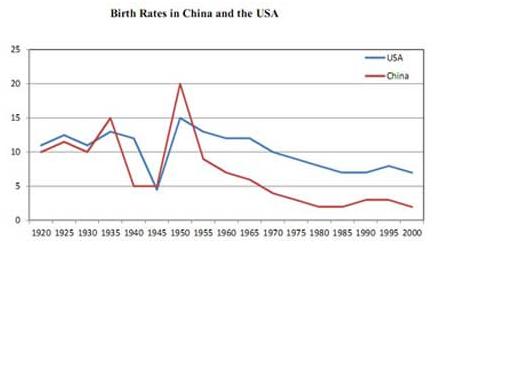
The graph shows the alteration of birth rates compare between China and USA from 1920 to 2000.
Overall, the alteration of birth rates fluctuated slightly in the first data then decreased step by step in the last part every five years.
In China, every five years, alteration of birth rates to vary from 1920 to 1935 (approximately, from 10% to 15%). Next, it undergoes to decrease until 1940 about 5% then leveled off until 1945 before increased sharply until 1950 namely 20%. Afterwards, the rates of birth decreased step by step until 2000 with average number 2%.
In the other hand, in USA has data than almost same as in China. From 1920 to 1940, birth rates to fluctuate about 11% until 12% every five years. Then, the data declined sharply until 1945 that is 5%. Furthermore, the data started to rise sharply in 1950 around 15% and started to fall again in 2000 that is about 3%.

Birth_rates_China_US.jpg
