The graph & chart give information and forecast about the vehicle and CO2 emission (England, Wales)
number of vehicles and co2 emissions
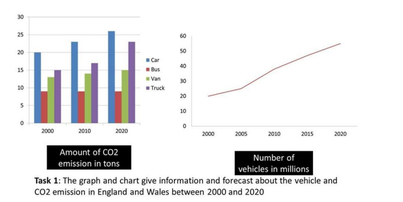
The given bar chart illustrates the amount of co2 emission and the line graph shows the number of vehicles in England and Wales between 2000 and 2020.
Overall, the emission in 2020 was the highest, especially for car emissions. The number of transportations had increase significantly during this period of time.
The emissions from cars was the highest in every year and it gradual increased from 20 tons in 2000 to over 25 tons in 2020. The truck and van emissions also witnessed a growth. The amount of emission from truck grew from 17 tons in 2000 to 18 tons while the van emissions slightly rose to 15 tons in 2020. In contrast, the emissions from bus remain stable all the time at around 9 tons.
The number of vehicles increased from 20 million from 2000 to about 40 million in 2010 and reached a peak of 55 million in 2020.
289614335_3246475625.png
Holt Educational Consultant - / 15385 The writer has not made an effort to provide a complete summary and analysis of the 2 images. Had he done so, he would have written more than 151 words. The summary overview alone is incomplete in reference and incorrect in sentence structure. Why the writer chose to combine 2 different topics in one sentence is beyond me. Not a single linking device was used to showa relation between the 2 different image subjects. Even the measurement basis for each was overlooked creating a little informative summary. As far as trending statements go, this one does not present a well developed trend either. It is almost like the author has no interest in passing the test.
The sentence structures are not well presented either. Problems with simple complex, and compound presentations abound to the point where the GRA score will be limited in consideration. An essay like this is the work of either a first time writer, in which care this review will help with improvements or, the student just does not care if he passes or fails the test. He just completed enough work for scoring consideration and not of the passing kind.
Home / Writing Feedback / The graph & chart give information and forecast about the vehicle and CO2 emission (England, Wales) |
Need Writing or Editing Help?